. 2012 Jul;17(7):071304.
doi: 10.1117/1.JBO.17.7.071304.

Molecular imaging of water binding state and diffusion in breast cancer using diffuse optical spectroscopy and diffusion weighted MRI

Affiliations

Molecular imaging of water binding state and diffusion in breast cancer using diffuse optical spectroscopy and diffusion weighted MRI

So Hyun Chung et al. J Biomed Opt. 2012 Jul.

Abstract

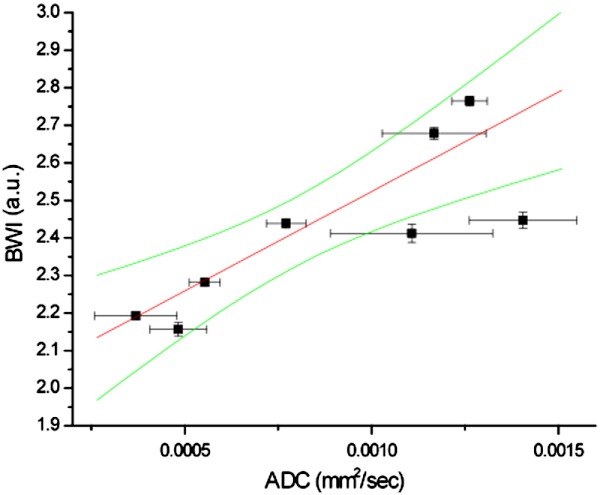
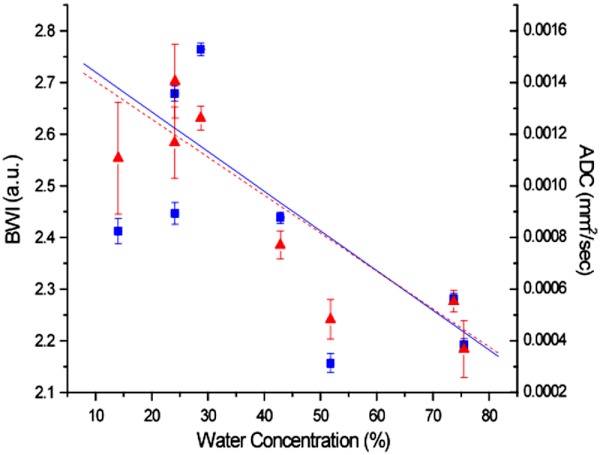
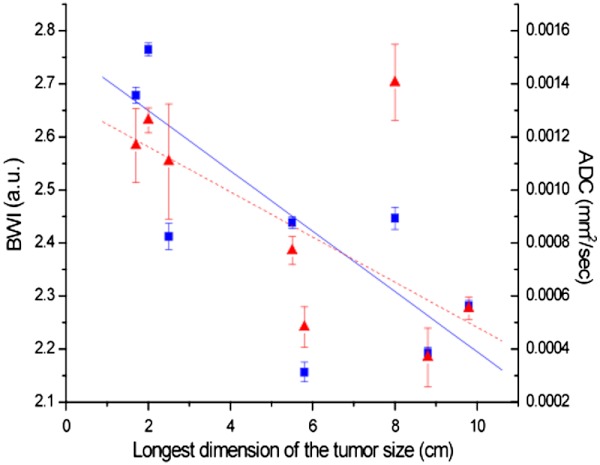
Tissue water content and molecular microenvironment can provide important intrinsic contrast for cancer imaging. In this work, we examine the relationship between water optical spectroscopic features related to binding state and magnetic resonance imaging (MRI)-measured water diffusion dynamics. Broadband diffuse optical spectroscopic imaging (DOSI) and MR images were obtained from eight patients with locally-advanced infiltrating ductal carcinomas (tumor size=5.5 ± 3.2 cm). A DOSI-derived bound water index (BWI) was compared to the apparent diffusion coefficient (ADC) of diffusion weighted (DW) MRI. BWI and ADC were positively correlated (R=0.90, p-value=0.003) and BWI and ADC both decreased as the bulk water content increased (R=-0.81 and -0.89, respectively). BWI correlated inversely with tumor size (R=-0.85, p-value=0.008). Our results suggest underlying sensitivity differences between BWI and ADC to water in different tissue compartments (e.g., extracellular vs cellular). These data highlight the potential complementary role of DOSI and DW-MRI in providing detailed information on the molecular disposition of water in breast tumors. Because DOSI is a portable technology that can be used at the bedside, BWI may provide a low-cost measure of tissue water properties related to breast cancer biology.


Figures

Fig. 1
Fig. 1
(a) In vivo tissue absorption spectrum (solid line) from normal breast tissue. (b) Tissue water spectrum after subtracting other tissue components’ spectra (solid line). (c) Normalized tissue water spectrum at 935 to 998 nm (solid line). The pure water spectrum at 36°C is shown in each panel (a, b, and c, dashed lines) for comparison. [a reprint with permission from IOP publishing, Phys. Med. Biol. 53 (2008) 6713–6727, doi:10.1088/0031-9155/53/23/005].
Fig. 2
Fig. 2
(a) Transverse dynamic-contrast MR image. The region of interest (red contour) used for ADC calculation and the locations used for lateral scanning of DOSI are shown with white boxes. (b) Sagittal diffusion-weighted-image is shown with the bars indicating where the DOSI probe was positioned axially. (c) Coronal maximum intensity projection image is shown with a yellow box approximating a boundary of the area measured by DOSI. (d) A DOSI acquired BWI image. Darker area with values less than FWHM of the entire points is shown to indicate a tumor area.
Fig. 3
Fig. 3
Correlation between BWI and ADC from in-vivo breast cancer measurements of 8 IDC patients (R=0.90, p-value=0.003). 95% confidence interval is shown with green lines. A positive correlation is seen in vivo, while negative correlation was previously described in homogeneous tissue phantoms (Ref. 6), suggesting that ADC and BWI are sensitive to water in different tumor compartments.
Fig. 4
Fig. 4
BWI (squares, solid line) and ADC (triangles, dashed line) vs. Bulk Water Concentration. Both correlate inversely with the bulk water concentration. (R=0.81 and p-value=0.016 for BWI, and R=0.89 and p-value=0.003 for ADC). The bound water fraction and the ADC both decrease as the total tumor water concentration increases.
Fig. 5
Fig. 5
Relationship between tumor size, BWI and ADC. The water parameters have similar correlation with tumor size, one of the most important prognostic indices of survival (R=0.85 and p-value=0.008 for BWI, and R=0.82 and p-value=0.013 for ADC).

Similar articles

Cited by

References

    1. Manton D. J., et al. , “Neoadjuvant chemotherapy in breast cancer: early response prediction with quantitative MR imaging and spectroscopy (vol 94, pg 1554, 2006),” Br. J. Cancer 94(10), 1554–1554 (2006).BJCAAI10.1038/sj.bjc.6603165 - DOI - PMC - PubMed
    1. Sickles E. A., “Breast masses: mammographic evaluation,” Radiology 173(2), 297–303 (1989).RADLAX - PubMed
    1. Tromberg B. J., et al. , “Assessing the future of diffuse optical imaging technologies for breast cancer management,” Med. Phys. 35(6), 2443–2451 (2008).MPHYA610.1118/1.2919078 - DOI - PMC - PubMed
    1. Cerussi A. E., et al. , “In vivo absorption, scattering, and physiologic properties of 58 malignant breast tumors determined by broadband diffuse optical spectroscopy,” J. Biomed. Opt. 11(4), 044005 (2006).JBOPFO10.1117/1.2337546 - DOI - PubMed
    1. Chu D. Z. J., et al. , “Proton nmr of human-breast tumors—correlation with clinical prognostic parameters,” J. Surg. Oncol. 36(1), 1–4 (1987).JSONAU10.1002/(ISSN)1096-9098 - DOI - PubMed

Publication types