. 2012 Jul;17(7):076019.
doi: 10.1117/1.JBO.17.7.076019.

Spectrally enhanced imaging of occlusal surfaces and artificial shallow enamel erosions with a scanning fiber endoscope

Affiliations

Spectrally enhanced imaging of occlusal surfaces and artificial shallow enamel erosions with a scanning fiber endoscope

Liang Zhang et al. J Biomed Opt. 2012 Jul.

Abstract

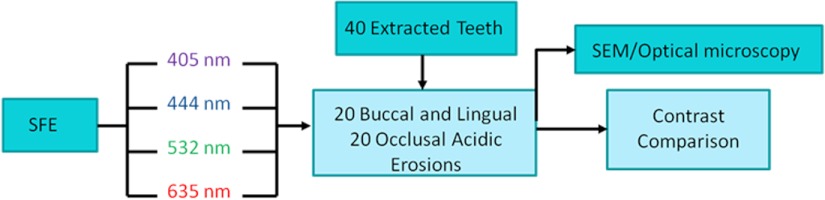
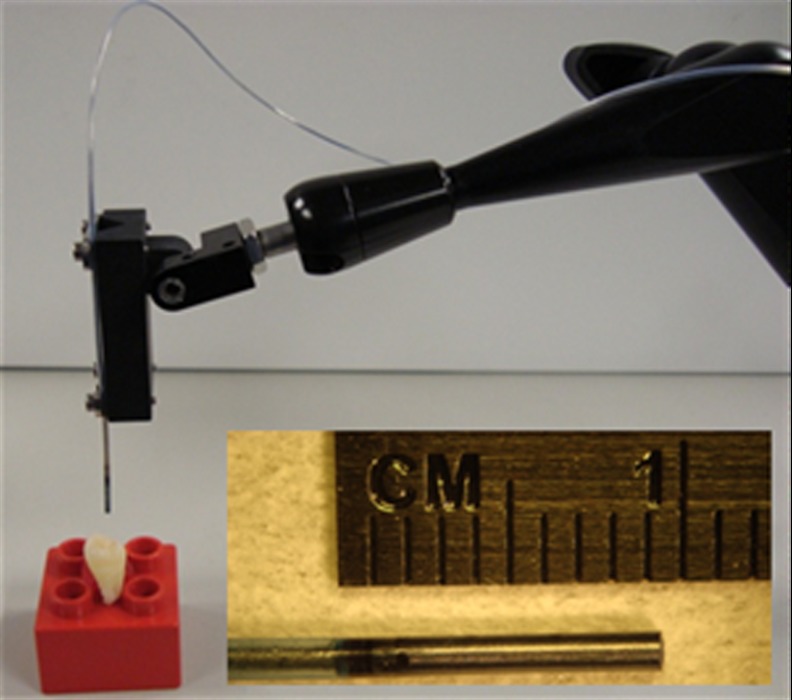
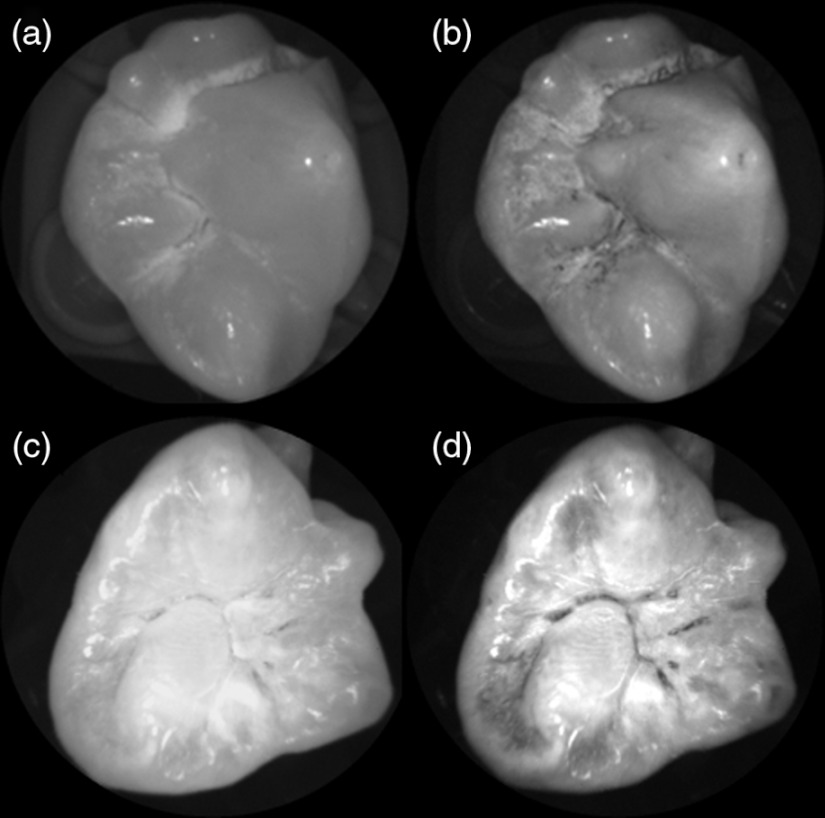
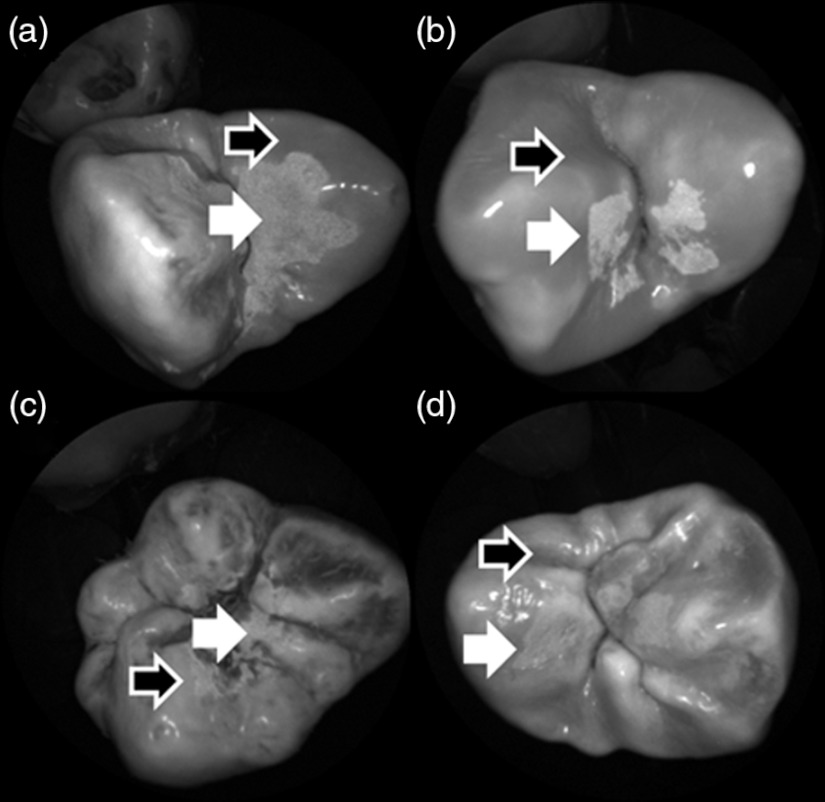
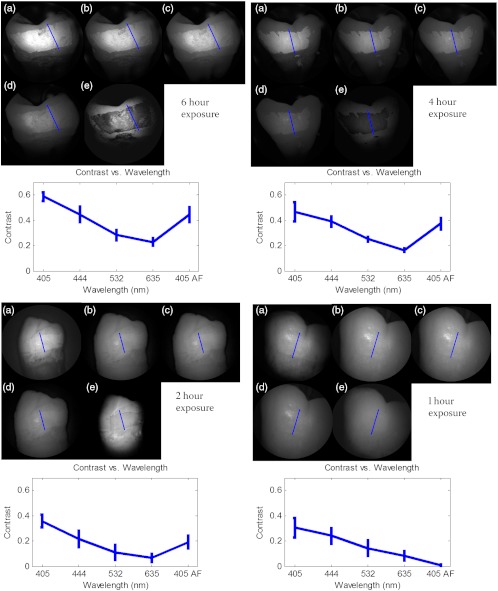
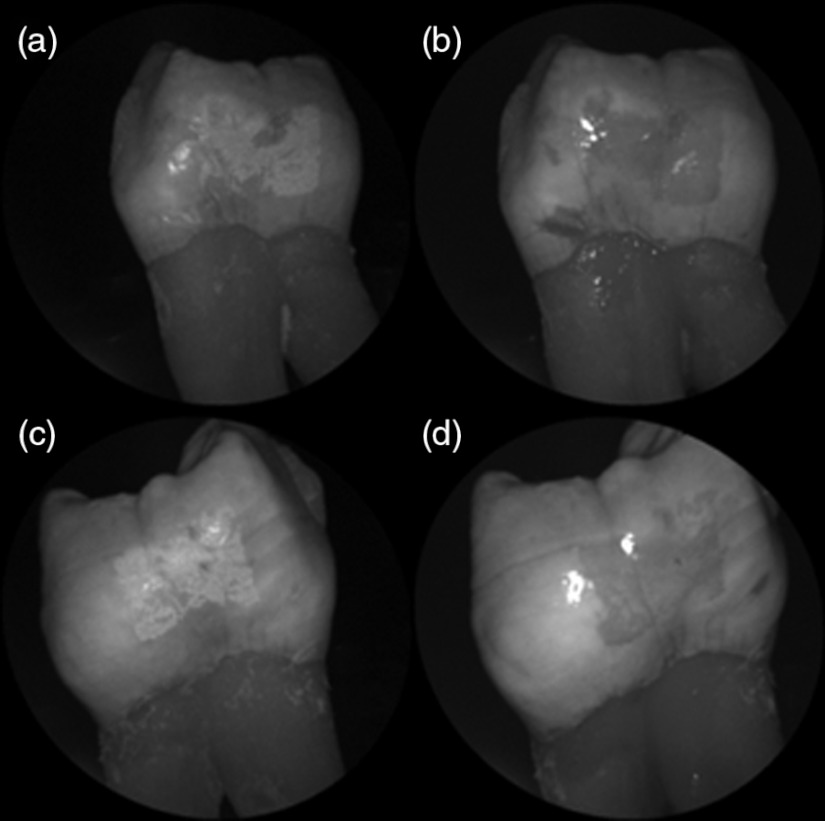
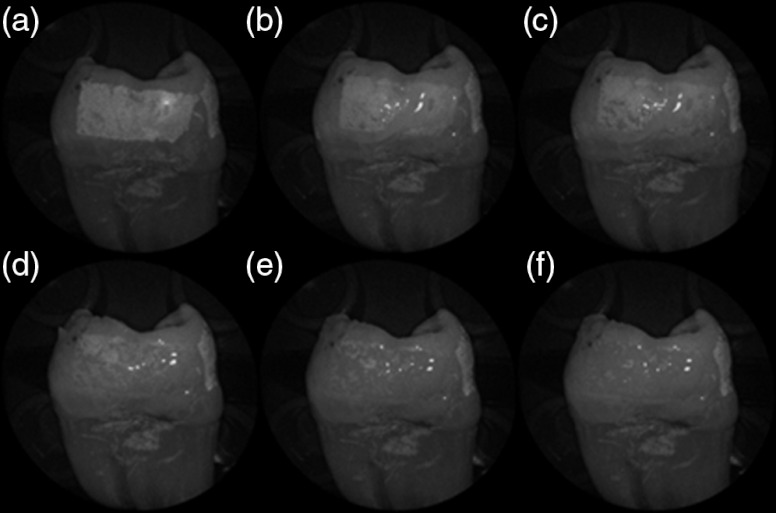
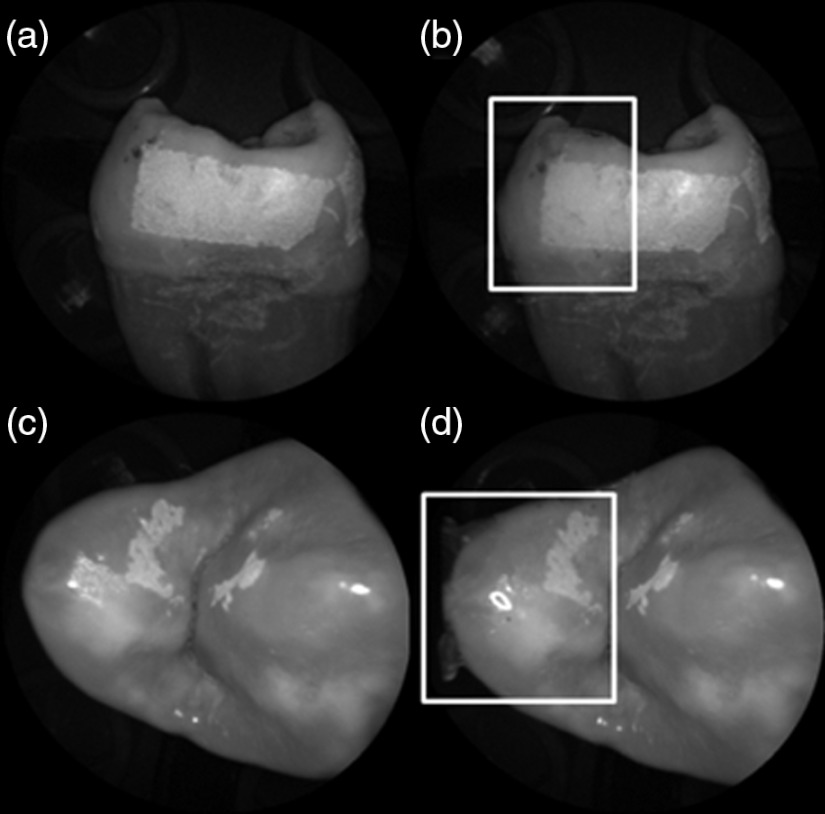
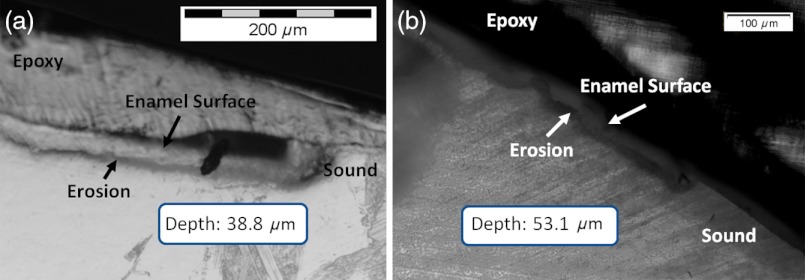
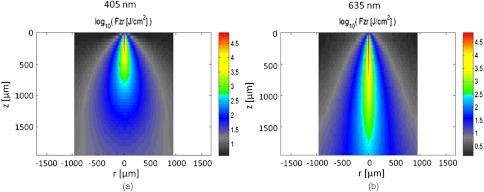
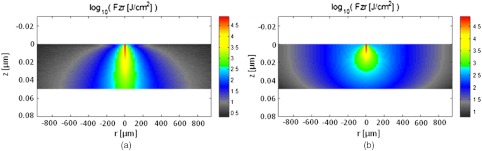
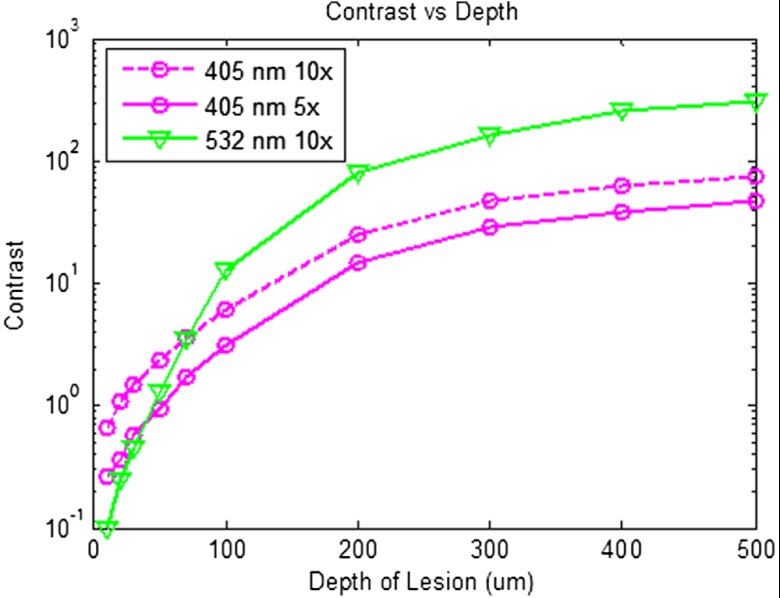
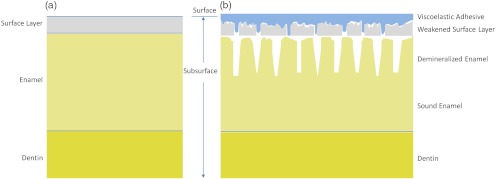
An ultrathin scanning fiber endoscope, originally developed for cancer diagnosis, was used to image dental occlusal surfaces as well as shallow artificially induced enamel erosions from human extracted teeth (n=40). Enhanced image resolution of occlusal surfaces was obtained using a short-wavelength 405-nm illumination laser. In addition, artificial erosions of varying depths were also imaged with 405-, 404-, 532-, and 635-nm illumination lasers. Laser-induced autofluorescence images of the teeth using 405-nm illumination were also obtained. Contrast between sound and eroded enamel was quantitatively computed for each imaging modality. For shallow erosions, the image contrast with respect to sound enamel was greatest for the 405-nm reflected image. It was also determined that the increased contrast was in large part due to volume scattering with a smaller component from surface scattering. Furthermore, images obtained with a shallow penetration depth illumination laser (405 nm) provided the greatest detail of surface enamel topography since the reflected light does not contain contributions from light reflected from greater depths within the enamel tissue. Multilayered Monte Carlo simulations were also performed to confirm the experimental results.


Figures

Fig. 1
Fig. 1
Flow chart of the experiment. 40 extracted teeth were used. Out of the 40 teeth, 20 teeth were used to make smooth surface erosions of varying severity, and the remaining 20 were used to make occlusal surface erosions. The SFE was used to image all teeth with four different laser wavelengths. Contrast between sound and eroded enamel was then measured from the images. The artificially induced erosions were also characterized via SEM and optical microscopy.
Fig. 2
Fig. 2
The SFE probe held by a mounting fixture. By scanning in an outward spiral pattern, large FOV high-quality images can be obtained with a 1.2-mm-diameter probe. The inset shows a magnified view of the distal end of the probe.
Fig. 3
Fig. 3
SFE images of the occlusal surface of a tooth illuminated with (a) 635-nm and (b) 405-nm lasers. SFE images of the occlusal surface of another tooth illuminated with (c) 635-nm and (d) 405-nm lasers. Enhanced topography details are evident in the 405-nm images. Pitting can be also seen in the violet illuminated images.
Fig. 4
Fig. 4
405-nm reflected images of occlusal erosions produced by submersion in acetic acid solution of pH 3 for (a) 6 h, (b) 4 h, (c) 2 h, and (d) 1 h. Black arrows indicates sound enamel, while white solid arrows indicates eroded enamel.
Fig. 5
Fig. 5
Contrast between smooth surface erosion and sound enamel for various illuminating wavelengths and acid exposure times. Top left: 6 h, pH 3 exposure. Top right: 4 h, pH 3 exposure. Bottom left: 2 h, pH 3. Bottom right: 1 h, pH 3. For all four panes: (a) 405-nm reflected image; (b) 444-nm reflected image; (c) 532-nm reflected image; (d) 635-nm reflected image, and (e) 405-nm illuminated AF image. Mean and standard deviation of measured contrast for each imaging modality are shown in the plots. Blue line in each image indicates location where contrast was measured.
Fig. 6
Fig. 6
405-nm backscattered image of four hour eroded specimens (a) before and (b) after application of index matching fluid (top) and glycerol (bottom). After application, a reversal in contrast is seen between the eroded and sound enamel.
Fig. 7
Fig. 7
Time sequence of a 6 h eroded specimen with application of optical gel taken at (a) 0 s, (b) 5 s, (c) 15 s, (d) 30 s, (e) 1 min, and (f) 2 min using 405-nm illumination. A reversal of intensity between the eroded region and sound enamel occurs over this time span as the optical gel penetrates into the porous subsurface enamel within the erosion.
Fig. 8
Fig. 8
405-nm images of (top) a 6 h specimen (a) prior to application of transparent viscoelastic pressure sensitive adhesive, and (b) after application of adhesive. The measured contrast for this specimen is 0.6 prior and 0.45 after application of adhesive. 405-nm images of (bottom) a 4 h occlusal specimen (c) prior to application of sensitive adhesive, and (d) after application of adhesive. The measured contrast for this specimen is 0.42 prior and 0.32 after application of adhesive. The white boxes in (b) and (d) represent the region where the adhesive was applied. No reversal in contrast between eroded and sound enamel is seen, indicating that the adhesive did not fill subsurface voids.
Fig. 9
Fig. 9
405-nm image taken of sandblasted glass placed over a test target. The roughened surface scatters the 405-nm light, and thus the target is not visible through the sandblasted glass. However, the textured surface was wetted out after application of the transparent viscoelastic pressure sensitive adhesive, and thus the target became visible through the glass.
Fig. 10
Fig. 10
SEM of a specimen after acetic acid demineralization at pH 3 for 2 h. (a) Zoomed-out view of erosion (center of image) and sound enamel above and below. Scale bar is 500 μm.(b) Zoomed-in view of center of erosion. Porous structure of the erosion is clearly evident. Scale bar is 1 μm. (c) Zoomed-in view of the sound enamel. Compared to the demineralized region, the sound enamel is less rough and lacks pores. Scale bar is 1 μm.
Fig. 11
Fig. 11
SEM of a tooth after acetic acid demineralization at pH 3 for 4 h. A critical point drying technique was used to remove the surface layer without mechanical abrasion. (a) Enamel prisms are seen after removal of enamel surface layer. The lower right corner of (a) shows a portion of intact surface layer still present, while the central portion of the image shows the subsurface enamel. Scale bar is 50 μm. (b) Zoomed-in view of exposed enamel subsurface. Scale bar is 5 μm. Demineralization of the subsurface enamel is evidenced by the voids in the enamel prism cores.
Fig. 12
Fig. 12
(a) Cross section of a 4 h eroded tooth viewed from the fractured and polished side using dye stained microscopy. Dye penetration into the demineralized channels allows for visualization of the erosion depth. The dark region to right of the arrow is a void between the epoxy and enamel. An erosion of approximately 39 μm is shown. (b) Polarized transmission microscopy of a 6 h eroded tooth from a 250-μm-thickness slice. An erosion of approximately 53 μm is shown. The outer surfaces of the teeth are indicated by the arrows.
Fig. 13
Fig. 13
Flux of illuminating light into enamel tissue. (a) 405-nm photons are strongly scattered and thus do not penetrate deeply into enamel (z axis). At 500 μm, flux drops by a factor of 30. (b) 635-nm photons are not strongly scattered and therefore exhibits a highly ballistic trajectory. Only after 1200 μm does the 635-nm flux drop by a factor of 30.
Fig. 14
Fig. 14
Photon flux for 405-nm wavelength in (a) sound enamel and (b) demineralized enamel. Scattering coefficient used in (a) was 264  cm1 and in (b) was 2640  cm1.
Fig. 15
Fig. 15
Demineralized enamel contrast of varying depths. MC simulations showed that illumination using 405 nm with 10× as well as 5× increased scattering from sound to demineralized enamel provided higher contrast than 532 nm for shallow lesions. As demineralized enamel depth increased, the 405-nm curve flattened out more rapidly than the 532-nm curve. Additionally, a crossing in contrast was seen between 532 and 405 nm (5× increased scattering) at approximately 70 μm.
Fig. 16
Fig. 16
Cross-sectional depiction of a tooth (a) prior to acid challenge and (b) after acid challenge. After acid exposure, the amorphous surface layer is weakened, creating a porous and roughened outer surface. The pores allow acid to attack the underlying enamel, leading to demineralized enamel prism cores. Therefore, both scattering from the surface (from the roughened amorphous layer) and subsurface volume scattering (from the porous demineralized enamel) is present. However, after the application of a viscoelastic pressure-sensitive adhesive to the surface of the tooth, the adhesive fills the majority of the roughened surface, thus minimizing surface scattering without affecting volume scattering.

Similar articles

Cited by

References

    1. Nahás Pires Corrêa M. S., et al. , “Prevalence and associated factors of dental erosion in children and adolescents of a private dental practice,” Int. J. Paediatr. Dent. 21(6), 451–458 (2011). - PubMed
    1. Jaeggi T., Lussi A., “Prevalence, incidence and distribution of erosion,” Monogr. Oral. Sci. 20, 44–65 (2006).MGUSCU - PubMed
    1. Gandara B. K., Truelove E. L., “Diagnosis and management of dental erosion,” J. Contemp. Dent. Practice 1(1), 1–17 (1999). - PubMed
    1. Attin T., “Methods for assessment of dental erosion,” Monogr. Oral. Sci. 20, 152–172 (2006).MGUSCU - PubMed
    1. ten Bosch J. J., van der Mei H. C., Borsboom P. C. F., “Optical monitor of in vitro caries,” Caries Res. 18(6), 540–547 (1984).CAREBK10.1159/000260818 - DOI - PubMed

Publication types

MeSH terms