Mutant p53 is a transcriptional co-factor that binds to G-rich regulatory regions of active genes and generates transcriptional plasticity
- PMID: 22894900
- PMCID: PMC3466528
- DOI: 10.4161/cc.21646
Mutant p53 is a transcriptional co-factor that binds to G-rich regulatory regions of active genes and generates transcriptional plasticity
Abstract
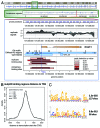
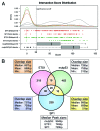
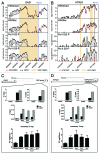
The molecular mechanisms underlying mutant p53 (mutp53) "gain-of-function" (GOF) are still insufficiently understood, but there is evidence that mutp53 is a transcriptional regulator that is recruited by specialized transcription factors. Here we analyzed the binding sites of mutp53 and the epigenetic status of mutp53-regulated genes that had been identified by global expression profiling upon depletion of endogenous mutp53 (R273H) expression in U251 glioblastoma cells. We found that mutp53 preferentially and autonomously binds to G/C-rich DNA around transcription start sites (TSS) of many genes characterized by active chromatin marks (H3K4me3) and frequently associated with transcription-competent RNA polymerase II. Mutp53-bound regions overlap predominantly with CpG islands and are enriched in G4-motifs that are prone to form G-quadruplex structures. In line, mutp53 binds and stabilizes a well-characterized G-quadruplex structure in vitro. Hence, we assume that binding of mutp53 to G/C-rich DNA regions associated with a large set of cancer-relevant genes is an initial step in their regulation by mutp53. Using GAS1 and HTR2A as model genes, we show that mutp53 affects several parameters of active transcription. Finally, we discuss a dual mode model of mutp53 GOF, which includes both stochastic and deterministic components.
Figures


Similar articles
-
Modulation of gene expression in U251 glioblastoma cells by binding of mutant p53 R273H to intronic and intergenic sequences.Nucleic Acids Res. 2009 Apr;37(5):1486-500. doi: 10.1093/nar/gkn1085. Epub 2009 Jan 12. Nucleic Acids Res. 2009. PMID: 19139068 Free PMC article.
-
Pontin, a new mutant p53-binding protein, promotes gain-of-function of mutant p53.Cell Death Differ. 2015 Nov;22(11):1824-36. doi: 10.1038/cdd.2015.33. Epub 2015 Apr 10. Cell Death Differ. 2015. PMID: 25857266 Free PMC article.
-
The activating transcription factor 3 protein suppresses the oncogenic function of mutant p53 proteins.J Biol Chem. 2014 Mar 28;289(13):8947-59. doi: 10.1074/jbc.M113.503755. Epub 2014 Feb 19. J Biol Chem. 2014. PMID: 24554706 Free PMC article.
-
Mutant p53 Gain of Function and Chemoresistance: The Role of Mutant p53 in Response to Clinical Chemotherapy.Chemotherapy. 2017;62(1):43-53. doi: 10.1159/000446361. Epub 2016 Jun 21. Chemotherapy. 2017. PMID: 27322648 Review.
-
Gain-of-function mutant p53 in cancer progression and therapy.J Mol Cell Biol. 2020 Sep 1;12(9):674-687. doi: 10.1093/jmcb/mjaa040. J Mol Cell Biol. 2020. PMID: 32722796 Free PMC article. Review.
Cited by
-
The p53 Pathway in Glioblastoma.Cancers (Basel). 2018 Sep 1;10(9):297. doi: 10.3390/cancers10090297. Cancers (Basel). 2018. PMID: 30200436 Free PMC article. Review.
-
ERα determines the chemo-resistant function of mutant p53 involving the switch between lincRNA-p21 and DDB2 expressions.Mol Ther Nucleic Acids. 2021 Aug 8;25:536-553. doi: 10.1016/j.omtn.2021.07.022. eCollection 2021 Sep 3. Mol Ther Nucleic Acids. 2021. PMID: 34589276 Free PMC article.
-
Evaluating the Influence of a G-Quadruplex Prone Sequence on the Transactivation Potential by Wild-Type and/or Mutant P53 Family Proteins through a Yeast-Based Functional Assay.Genes (Basel). 2021 Feb 15;12(2):277. doi: 10.3390/genes12020277. Genes (Basel). 2021. PMID: 33672023 Free PMC article.
-
DNA and RNA quadruplex-binding proteins.Int J Mol Sci. 2014 Sep 29;15(10):17493-517. doi: 10.3390/ijms151017493. Int J Mol Sci. 2014. PMID: 25268620 Free PMC article. Review.
-
IFI16 Preferentially Binds to DNA with Quadruplex Structure and Enhances DNA Quadruplex Formation.PLoS One. 2016 Jun 9;11(6):e0157156. doi: 10.1371/journal.pone.0157156. eCollection 2016. PLoS One. 2016. PMID: 27280708 Free PMC article.
References
-
- Brosh R, Rotter V. When mutants gain new powers: news from the mutant p53 field. Nat Rev Cancer. 2009;9:701–13. - PubMed
Publication types
MeSH terms
Substances
LinkOut - more resources
Full Text Sources
Other Literature Sources
Molecular Biology Databases
Research Materials
Miscellaneous
