. 2012 Sep;8(9):1371-82.
doi: 10.4161/auto.21028. Epub 2012 Aug 16.

A novel image-based cytometry method for autophagy detection in living cells

Affiliations

A novel image-based cytometry method for autophagy detection in living cells

Leo Li-Ying Chan et al. Autophagy. 2012 Sep.

Abstract

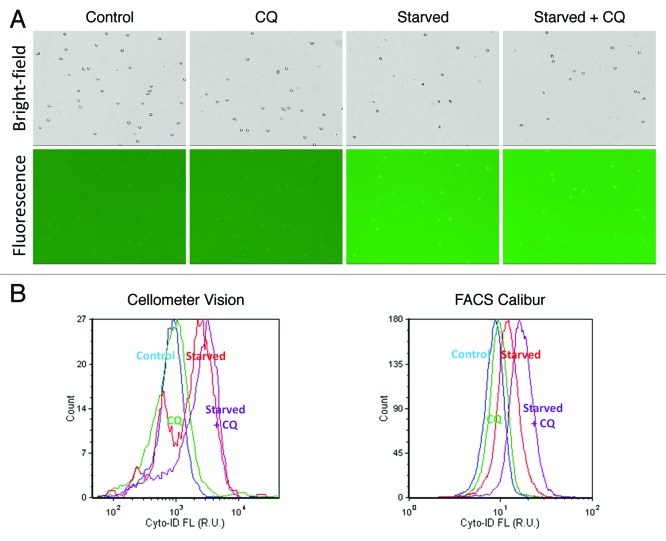
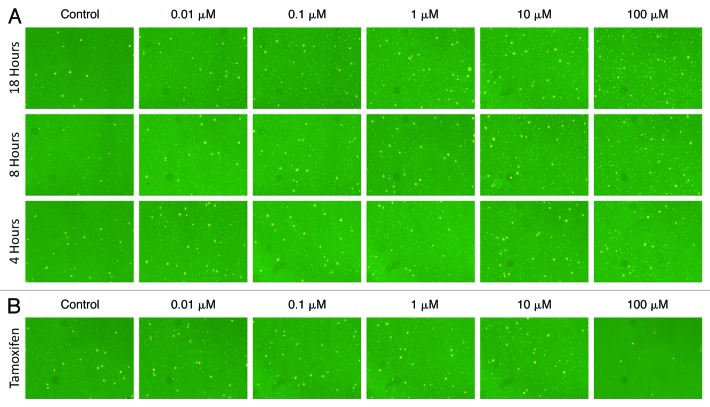
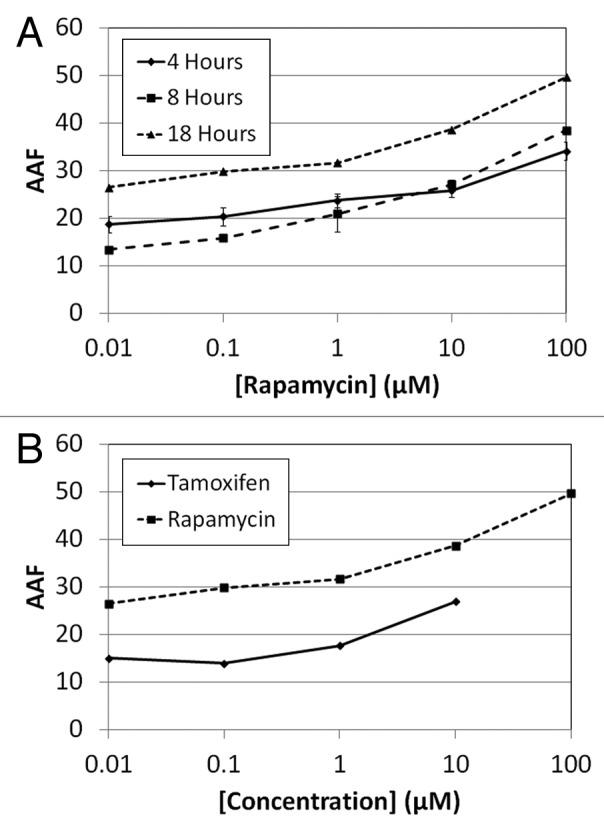
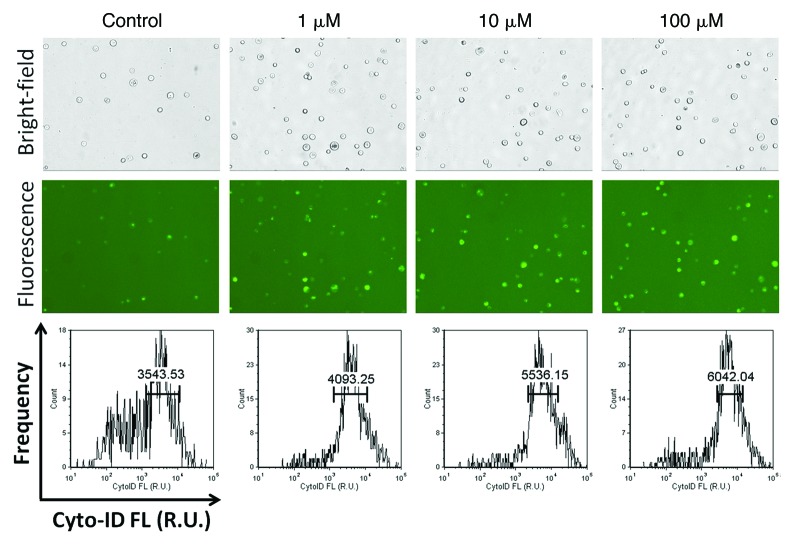
Autophagy is an important cellular catabolic process that plays a variety of important roles, including maintenance of the amino acid pool during starvation, recycling of damaged proteins and organelles, and clearance of intracellular microbes. Currently employed autophagy detection methods include fluorescence microscopy, biochemical measurement, SDS-PAGE and western blotting, but they are time consuming, labor intensive, and require much experience for accurate interpretation. More recently, development of novel fluorescent probes have allowed the investigation of autophagy via standard flow cytometry. However, flow cytometers remain relatively expensive and require a considerable amount of maintenance. Previously, image-based cytometry has been shown to perform automated fluorescence-based cellular analysis comparable to flow cytometry. In this study, we developed a novel method using the Cellometer image-based cytometer in combination with Cyto-ID(®) Green dye for autophagy detection in live cells. The method is compared with flow cytometry by measuring macroautophagy in nutrient-starved Jurkat cells. Results demonstrate similar trends of autophagic response, but different magnitude of fluorescence signal increases, which may arise from different analysis approaches characteristic of the two instrument platforms. The possibility of using this method for drug discovery applications is also demonstrated through the measurement of dose-response kinetics upon induction of autophagy with rapamycin and tamoxifen. The described image-based cytometry/fluorescent dye method should serve as a useful addition to the current arsenal of techniques available in support of autophagy-based drug discovery relating to various pathological disorders.


Figures

None
Figure 1. Optical block diagram of the Cellometer Vision. The Cellometer Vision contains three signal acquisition/detection features: (1) Bright-field light source allows transmission light microscopy image analysis. (2) Fluorescence excitation light source in combination with excitation, dichroic and emission filter set allows epi-fluorescence imaging analysis. (3) Cellometer imaging software allows analysis of cell concentration, size and fluorescence intensity measurement.
None
Figure 2. Data analysis method for autophagy detection. (A and B) The fluorescent and bright-field images showed bright green fluorescent spots inside the Jurkat cells that represented Cyto-ID® Green autophagy dye stained autophagosomes/autolysosomes. In addition, samples were stained with propidium iodide, shown in the fluorescent image as orange signal, which facilitated identification of dead cells and allowing for their elimination from data analysis. (C) The fluorescence of propidium iodide was plotted with respect to Cyto-ID® Green autophagy dye signal, and the nonviable propidium iodide-positive Jurkat cell signals were removed to allow analysis of only the viable cells in (D) the Cyto-ID® Green autophagy dye fluorescence histogram.
None
Figure 3. Fluorescence microscopy images of autophagy-induced HeLa cells. (A) HeLa cells were incubated in EMEM (normal) or EBSS (minimal) medium at 37°C for 1 h. Following the incubation, both starved and control cells were stained with Cyto-ID® Green autophagy dye and Hoechst 33342 (pseudo color green and blue). A clear increase in green fluorescence was observed in nutrient-starved HeLa cells. Importantly, little to no staining of lysosomes in the control cells was observed. (B) HeLa cells were incubated in EMEM medium with 3 µM of rapamycin in the presence or absence of 10 mM of 3-MA at 37°C overnight. After overnight incubation, the cells were stained with Cyto-ID® Green autophagy dye. The rapamycin-induced accumulation of the dye was noticeably inhibited by the presence of 3-MA. (C) Transfected HeLa cells expressing RFP-LC3 (pseudo color red) were treated with 10 µM tamoxifen at 37°C overnight. After overnight incubation, the cells were stained with Cyto-ID® Green autophagy dye. The accumulation of green fluorescence mostly colocalized with the RFP-LC3 protein signal, indicating the specificity for autophagy detection.
None
Figure 4. Starvation and recovery assay. (A) Bright-field and fluorescent images of control, recovery and nutrient-starved Jurkat cells. The fluorescent images show strong fluorescence in the nutrient-starved Jurkat cells compared with the control and recovered samples. However, it was difficult to visually distinguish the fluorescence intensities between the control and recovered samples without examining the fluorescence histograms. (B) Fluorescence histograms measured using the Cellometer Vision and FACS Calibur instruments showed comparable trends, wherein nutrient-starved Jurkat cells displayed the highest fluorescence peak, followed by recovery and control samples.
None
Figure 5. Autophagic flux measurements. (A) Bright-field and fluorescent images of control, CQ only, nutrient-starved and nutrient-starved + CQ Jurkat cells. Visually, the fluorescence signals of control and nutrient-starved vs. their respective CQ counterparts did not show noticeable increases in signal. (B) By observing the fluorescence histograms, however, similar trends were observed using the Cellometer Vision and FACS Calibur instruments, wherein nutrient-starved + CQ treatment samples showed the highest signals, followed by nutrient-starved treatment samples, CQ only treatment samples and control samples.
None
Figure 6. Combined fluorescent images of Cyto-ID® Green autophagy dye and propidium iodide stained Jurkat cells. (A) Time-dependent dose response analysis of rapamycin-induced autophagy stained with Cyto-ID Green autophagy dye (pseudo color green) and propidium iodide (pseudo color orange). The green fluorescent autophagosomes inside the Jurkat cells increased as the rapamycin concentration increased, demonstrating the brightest fluorescence intensity after 18 h treatment with 100 µM of drug. (B) As for the dose response comparison at 18 h between rapamycin and tamoxifen, it was noticeable in the images that rapamycin (shown in Fig. 6A) induced higher fluorescence signals in the Jurkat cells. In addition, tamoxifen was found to be highly cytotoxic at 100 µM, with most of the Jurkat cells losing viability at this concentration of drug.
None
Figure 7. Calculated AAF values for drug dose response effects in Jurkat cells. (A) The calculated AAF values for rapamycin showed approximately 20% increase in autophagy at 18 h incubation. The 4 and 8 h samples were comparable, indicating rapamycin required more than 8 h of incubation in order to induce noticeable autophagy. (B) Both visually and analytically, rapamycin showed higher autophagic signals than tamoxifen after 18 h incubation. It was interesting to note that tamoxifen induced cytotoxicity at the highest concentration in contrast to rapamycin.
None
Figure 8. Rapamycin-induced autophagy in PC-3 cells. Bright-field (top) and fluorescent (middle) images of PC-3 cells induced with 0, 1, 10 and 100 µM of rapamycin for 4 h. The fluorescent images clearly showed the increase in fluorescence and population of Cyto-ID® Green autophagy dye-stained PC-3 cells, confirmed by the fluorescence histogram (bottom), showing increase in average fluorescence intensity as rapamycin concentration increased.

References

    1. Shintani T, Klionsky DJ. Autophagy in health and disease: a double-edged sword. Science. 2004;306:990–5. doi: 10.1126/science.1099993. - DOI - PMC - PubMed
    1. Kondo Y, Kanzawa T, Sawaya R, Kondo S. The role of autophagy in cancer development and response to therapy. Nat Rev Cancer. 2005;5:726–34. doi: 10.1038/nrc1692. - DOI - PubMed
    1. Huang J, Klionsky DJ. Autophagy and human disease. Cell Cycle. 2007;6:1837–49. doi: 10.4161/cc.6.15.4511. - DOI - PubMed
    1. Hippert MM, O’Toole PS, Thorburn A. Autophagy in cancer: good, bad, or both? Cancer Res. 2006;66:9349–51. doi: 10.1158/0008-5472.CAN-06-1597. - DOI - PubMed
    1. Lee HK, Iwasaki A. Autophagy and antiviral immunity. Curr Opin Immunol. 2008;20:23–9. doi: 10.1016/j.coi.2008.01.001. - DOI - PMC - PubMed

LinkOut - more resources