Comparative Study
. 2013 Jan;7(1):85-95.
doi: 10.1038/ismej.2012.81. Epub 2012 Aug 16.

Distinct cutaneous bacterial assemblages in a sampling of South American Amerindians and US residents

Affiliations
Comparative Study

Distinct cutaneous bacterial assemblages in a sampling of South American Amerindians and US residents

Martin J Blaser et al. ISME J. 2013 Jan.

Abstract

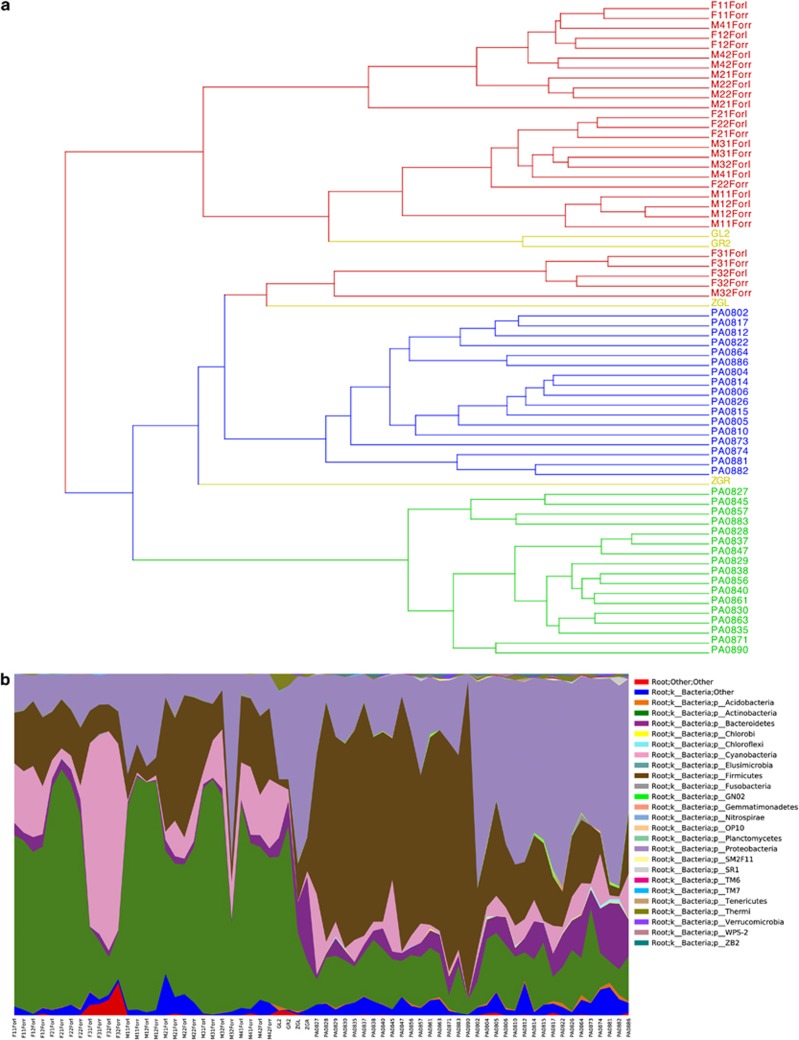
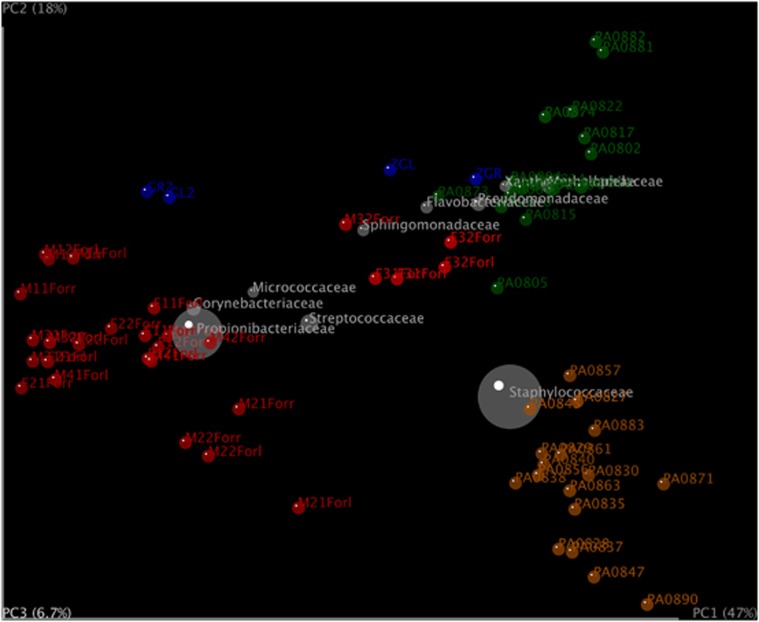
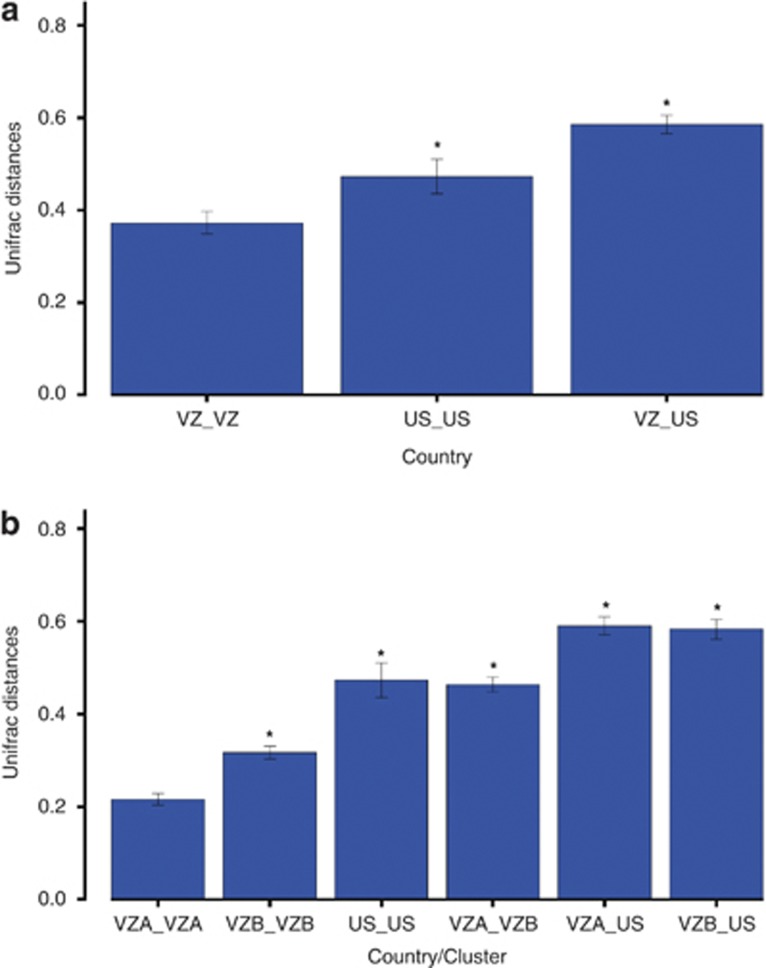
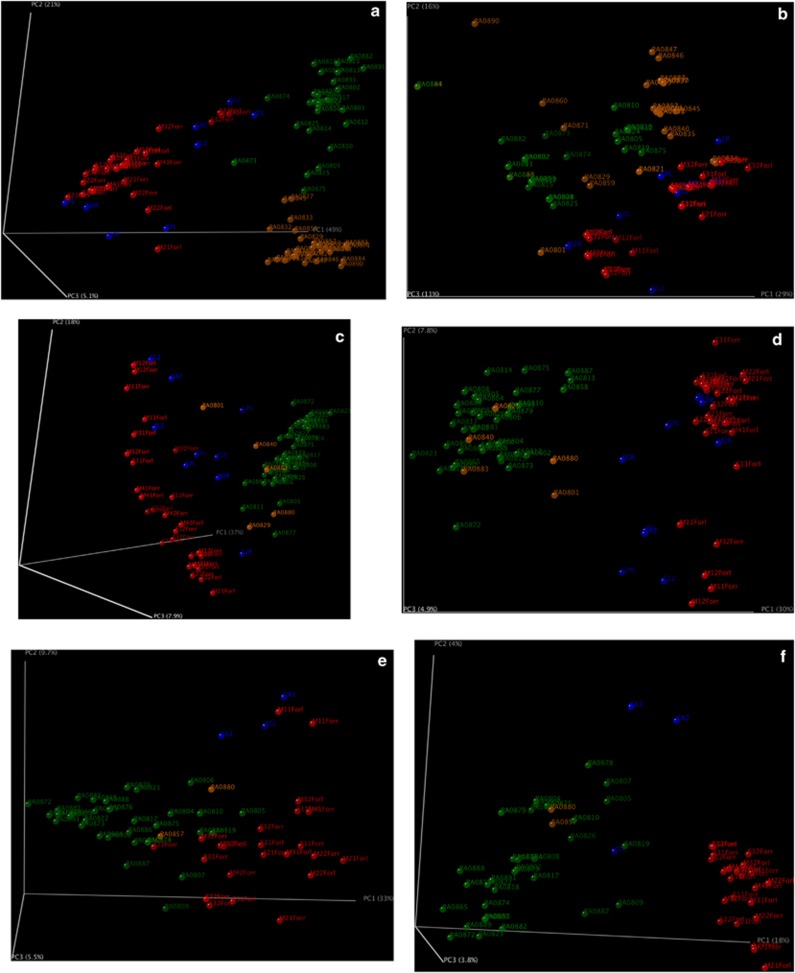
The human skin harbors complex bacterial communities. Prior studies showing high inter-individual variation focused on subjects from developed countries. We therefore compared cutaneous bacterial communities of Amerindians in the Venezuelan Amazon with subjects in the United States. Forearm skin specimens were studied from healthy Amerindians in Platanillal village in Amazonas State, and from healthy persons in New York and Colorado. All skin sampling used similar swab/buffer techniques. Multiplexed V2-targeted 16S rRNA gene pyrosequencing yielded high quality sequences from 112 samples. The results show 20 phyla, with three (Proteobacteria, Firmicutes, Actinobacteria) predominating. US residents and Venezuelan Amerindians had significantly different forearm skin bacterial community compositions, with United States dominated by Propionibacterium. Among the Amerindians, there was a deep split based on bacterial community membership, with 30 and 42 samples, respectively, falling into each of the two groups, not associated with age, gender, or body mass index. One Amerindian group had diversity similar to the United States, but was dominated by Staphylococcus rather than Propionibacterium. The other Amerindian group was significantly more diverse and even than the US or the other Amerindian group, and featured a broad range of Proteobacteria. The results provide evidence that ethnicity, lifestyle and/or geography are associated with the structure of human cutaneous bacterial communities.


Figures

Figure 1
Figure 1
Diversity among cutaneous forearm samples. The 66 samples with >400 sequences are compared in this analysis. (a) UPGMA based on weighted UniFrac distances. The code for all Amerindian subjects begins with Puerto Ayacucho (PA). For the 28 samples from the CO subjects (red), M or F refers to male or female; l and r, refer to left and right, respectively and numbers refer to subject identity. For the four NY specimens (blue), L and R refer to left and right, respectively. Jackknife analysis of the weighted UniFrac UPGMA tree with 100 repetitions at 400 sequences per sample shows strong support for the distinction of US and Amerindians. Of the samples from the Amerindian subjects, a deep branching was identified, dividing the samples into Cluster A (purple) and Cluster B (green). Several of the US samples are clustered with Cluster B, but none with Cluster A. (b) Taxon summary at phylum level for the 66 samples. The 34 Amerindian subjects shown are divided based on whether they are in Cluster A (gold; n=17) or B (green; n=17). The predominant phyla are indicated by color (see key).
Figure 2
Figure 2
Clustering of study subjects using PCoA based on weighted UniFrac distances. Samples represented by coloring, by location and by clustering (based on Figure 1). Colors are: red (Colorado), blue (NYC), green (Amerindian cluster B), orange (Amerindian cluster A). In the Bi-plot, 10 predominant OTUs are indicated by the size of the gray circle representing the abundance of the taxon.
Figure 3
Figure 3
Weighted UniFrac pairwise distances between several groups of samples. Groups shown are from US, Venezuela (VZ) samples, and Amerindian Cluster A (VZA), Amerindian Cluster B (VZB). Intra-group and inter-group distances compared using the Permanova statistic, *P<0.001 in comparison to the reference comparison, at left. (a) Intra- and inter-country distances. (b) Intra- and inter-cluster distances.
Figure 4
Figure 4
Effect of taxon abundance on clustering. The taxa represented in the 58 000 sequences were divided into three bins, and examined in weighted (a, c and e) and unweighted (b, d and f) UniFrac analyses. Taxa representing >1.0% (common) of the total abundance (a and b; 14 OTUs; 49.4% of all sequences); 0.1–1.0% (intermediate) of the total abundance (c and d; 113 OTUs; 29.6% of all sequences); and<0.1% (rare) of the total abundance (e and f; 1021 OTU; 20.9% of all sequences). Analyses were performed at the level of 100 sequences per sample; those samples with smaller numbers of sequences at particular stratifications are not shown. Clustering was compared using Permanova analysis to determine significant differences between US vs VZ, and Cluster A vs B. The colors are: Colorado (red); NYC (blue); Amerindian Cluster A (orange); Amerindian Cluster B (green).
Figure 5
Figure 5
Measures of intra-group diversity. (a) Alpha diversity rarefaction using observed species in Chao1 analysis. Colors are: red (Colorado), blue (NYC), orange (Amerindian Cluster A), green (Amerindian Cluster B). Values represent mean+s.d. at each level of sampling. (b) Shannon score for evenness. (c) Phylogenetic distances.

References

    1. Arumugan M, Raes J, Pelletier E, Le Paslier D, Yamada T, Mende DR, et al. Enterotypes of the human gut microbiome. Nature. 2011;473:174–180. - PMC - PubMed
    1. Avila M, Ojcius DM, Yilmaz O. The oral microbiota: living with a permanent guest. DNA Cell Biol. 2009;28:405–411. - PMC - PubMed
    1. Blaser MJ. Who are we? Indigenous microbes and the ecology of human diseases. EMBO Reports. 2006;7:956–960. - PMC - PubMed
    1. Blaser MJ, Falkow S. What are the consequences of the disappearing human microbiota. Nat Rev Microbiol. 2009;7:887–894. - PMC - PubMed
    1. Caporaso JG, Bittinger K, Bushman FD, DeSantis TZ, Andersen GL, Knight R. PyNAST: a flexible tool for aligning sequences to a template alignment. Bioinformatics. 2010;26:266–267. - PMC - PubMed

Publication types

MeSH terms