. 2012 Dec 1;303(11):C1129-38.
doi: 10.1152/ajpcell.00139.2012. Epub 2012 Aug 15.

Ethanol stimulates epithelial sodium channels by elevating reactive oxygen species

Affiliations

Ethanol stimulates epithelial sodium channels by elevating reactive oxygen species

Hui-Fang Bao et al. Am J Physiol Cell Physiol. .

Abstract

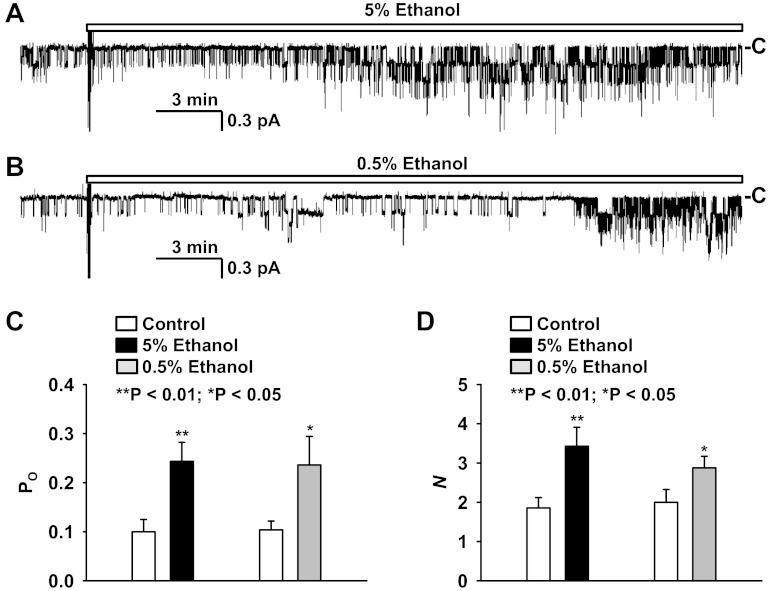
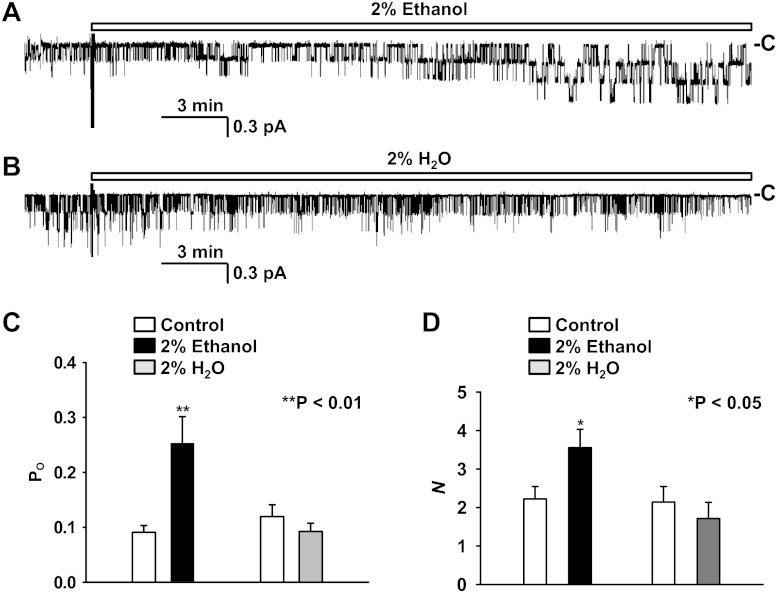
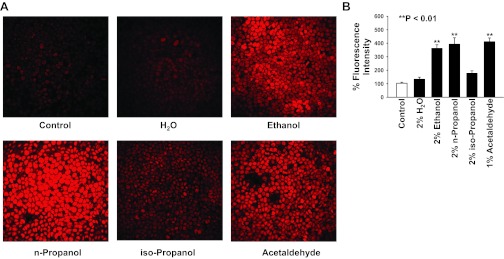
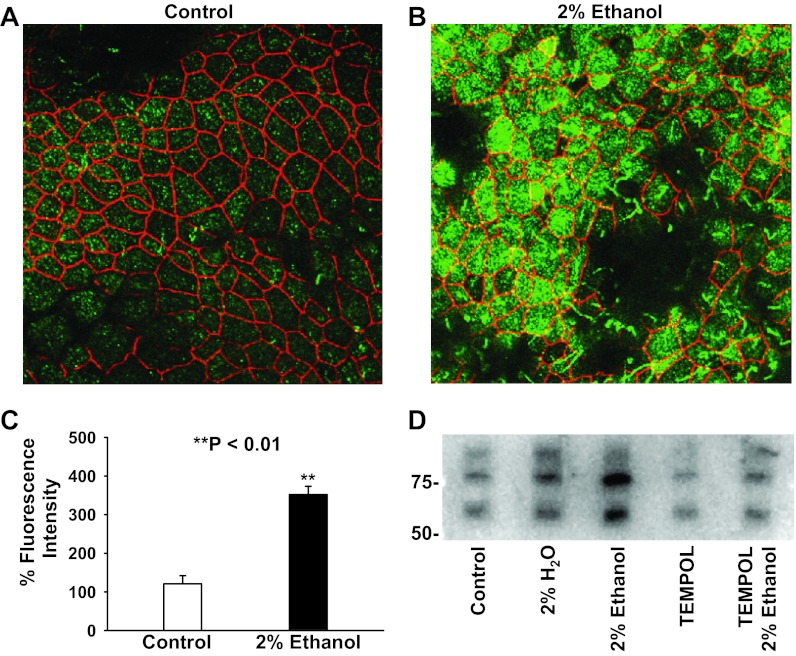
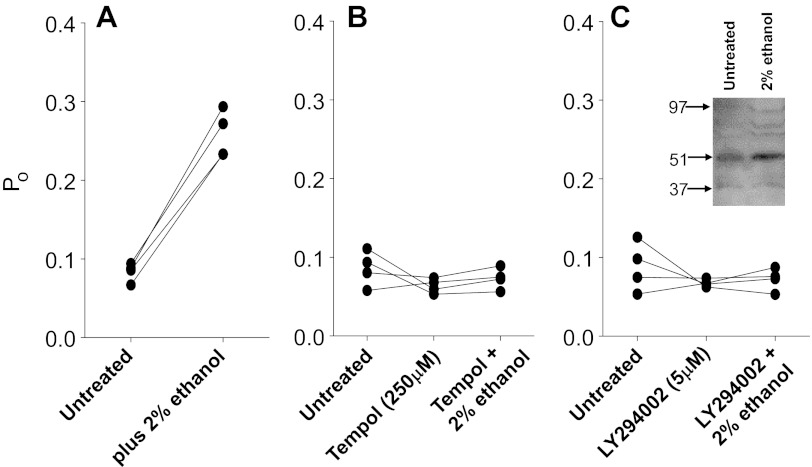
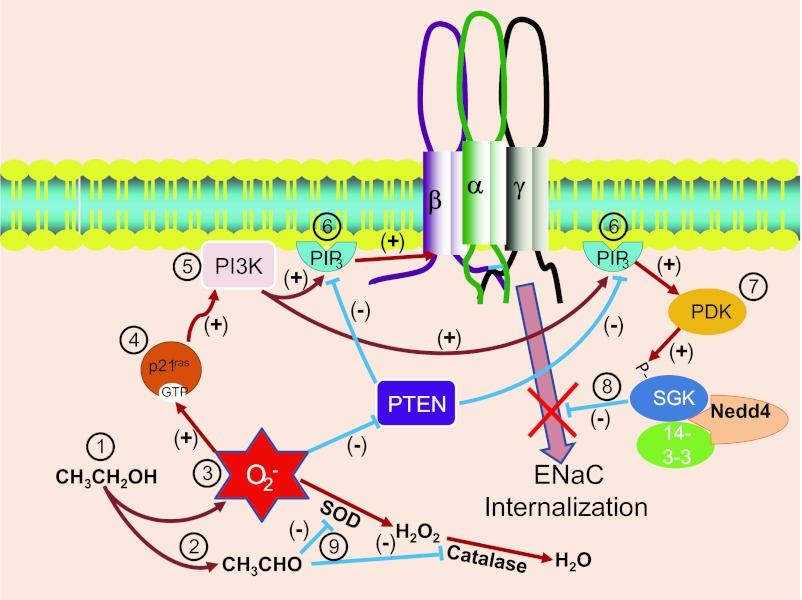
Alcohol affects total body sodium balance, but the molecular mechanism of its effect remains unclear. We used single-channel methods to examine how ethanol affects epithelial sodium channels (ENaC) in A6 distal nephron cells. The data showed that ethanol significantly increased both ENaC open probability (P(o)) and the number of active ENaC in patches (N). 1-Propanol and 1-butanol also increased ENaC activity, but iso-alcohols did not. The effects of ethanol were mimicked by acetaldehyde, the first metabolic product of ethanol, but not by acetone, the metabolic product of 2-propanol. Besides increasing open probability and apparent density of active channels, confocal microscopy and surface biotinylation showed that ethanol significantly increased α-ENaC protein in the apical membrane. The effects of ethanol on ENaC P(o) and N were abolished by a superoxide scavenger, 4-hydroxy-2,2,6,6-tetramethylpiperidinyloxy (TEMPOL) and blocked by the phosphatidylinositol 3-kinase inhibitor LY294002. Consistent with an effect of ethanol-induced reactive oxygen species (ROS) on ENaC, primary alcohols and acetaldehyde elevated intracellular ROS, but secondary alcohols did not. Taken together with our previous finding that ROS stimulate ENaC, the current results suggest that ethanol stimulates ENaC by elevating intracellular ROS probably via its metabolic product acetaldehyde.


Figures

Fig. 1.
Fig. 1.
Effects of 5% or 0.5% ethanol on epithelial sodium channel (ENaC) open probability (Po) and the number of active ENaC in patches (N). A: a representative cell-attached recording from an A6 cell before and after addition of 5% ethanol to the luminal bath. B: a representative cell-attached recording from another A6 cell before and after addition of 0.5% ethanol to the luminal bath. Downward transitions show the channel openings. “−C” shows the baseline when the channel is closed. C and D: summary plots of ENaC Po (C) and N (D) before (open bars) and after addition of either 5% (black bars) or 0.5% ethanol (gray bars) to the luminal bath.
Fig. 2.
Fig. 2.
Effects of 2% ethanol on ENaC Po and N. A: a representative cell-attached recording from an A6 cell before and after addition of 2% ethanol to the luminal bath. B: a representative cell-attached recording from another A6 cell before and after addition of 2% H2O to the luminal bath. C and D: summary plots of ENaC Po (C) and N (D) before (open bars) and after addition of either 2% ethanol (black bars) or 2% H2O (gray bars) to the luminal bath.
Fig. 3.
Fig. 3.
Effects of acetaldehyde on ENaC Po and N. A: a representative cell-attached recording from an A6 cell before and after addition of 1% acetaldehyde to the luminal bath. B and C: summary plots of ENaC Po (B) and N (C) in A6 cells before (open bars) and after addition of 1% acetaldehyde (black bars) to the luminal bath.
Fig. 4.
Fig. 4.
Effects of n-propanol or iso-propanol on ENaC Po and N. A: a representative cell-attached recording from an A6 cell before and after addition of 2% n-propanol to the luminal bath. B: a representative cell-attached recording from another A6 cell before and after addition of 2% iso-propanol to the luminal bath. C and D: summary plots of ENaC Po (C) and N (D) before (open bars) and after addition of either 2% n-propanol (black bars) or 2% iso-propanol (gray bars) to the luminal bath.
Fig. 5.
Fig. 5.
Confocal images of reactive oxygen species (ROS) in A6 cells either under control conditions or treated with 2% H2O, 2% ethanol, 2% n-propanol, 2% iso-propanol, or 1% acetaldehyde. Confluent A6 cells were stained with dihydroethidium, a membrane-permeable ROS-sensitive dye. A: confocal microscopy XY scanning was performed across A6 cell monolayers. B: summary plots of % fluorescence intensity from five experiments for each condition.
Fig. 6.
Fig. 6.
TEMPOL, a superoxide scavenger, abolishes the effects of ethanol on ENaC Po and N. A: a representative cell-attached recording from a control 2F3 cell before and after addition of 250 μM TEMPOL to the luminal bath. B: a representative cell-attached recording from another A6 cell pretreated with 250 μM TEMPOL before and after addition of 2% ethanol to the luminal bath. C and D: summary plots of ENaC Po (C) and N (D) either in control A6 cells before (open bars) and after addition of TEMPOL (gray bars) or in A6 cells pretreated with TEMPOL before (gray bars) and after addition of 2% ethanol (black bars) to the luminal bath.
Fig. 7.
Fig. 7.
Ethanol elevates apical expression of α-ENaC. A and B: confocal microscopy images of A6 cells either in control conditions (A) or treated with 2% ethanol for 30 min (B). Confluent A6 cells were labeled with antibodies to α-ENaC (shown in green) or ZO-1 (shown in red). C: summary plots of % green fluorescence intensity (α-ENaC) from five experiments in control A6 cells (open bar) and A6 cells treated with 2% ethanol (black bar). D: Western blot of α-ENaC in the apical membrane of either control A6 cells or A6 cells treated with 2% H2O, 2% ethanol, 250 μM TEMPOL alone, or 250 μM TEMPOL plus 2% ethanol. The data represent three experiments showing similar results.
Fig. 8.
Fig. 8.
A phosphatidylinositol 3-kinase (PI-3-kinase) inhibitor blocks the effect of ethanol as strongly as a ROS scavenger. ENaC Po from individual patches was measured, always starting with untreated patches before application of treatments to the same patch. This protocol used individual patches as their own controls and therefore reduced the effect of patch-to-patch variability in Po. A: untreated followed by 2% ethanol. B: untreated followed by TEMPOL followed by 2% ethanol. TEMPOL blocked the effect of ethanol. C: untreated followed by the PI-3-kinase inhibitor LY294002 followed by ethanol. LY294002 blocked the action of ethanol as effectively as TEMPOL. There was no significant effect of ethanol after ROS removal or after PI-3-kinase inhibition to prevent production of PIP3. Inset: Western blot of SGK before and 20 min after the addition of 2% ethanol. In this and three other experiments, SGK was increased by a comparable amount.
Fig. 9.
Fig. 9.
Schematic diagram of the mechanism for ENaC stimulation by ethanol. At 1, ethanol is metabolized to produce acetaldehyde (at 2) and ROS (at 3). ROS activates p21 K-Ras (at 4) and K-Ras stimulates PI-3-kinase (PI3K) (at 5). PI-3-kinase produces phosphatidylinositol-tris-phosphate (PIP3) (at 6). PIP3 can directly interact with ENaC to increase open probability (as we have shown in this paper). In addition, PIP3 can activate other molecules with pleckstrin homology domains including phosphatidylinositol-dependent kinase (PDK) (at 7). PDK phosphorylates serum- and glucocorticoid-dependent kinase (SGK1) that phosphorylates Nedd4–2 to prevent Nedd4-mediated ENaC internalization (at 8) and thereby allow an accumulation of ENaC in the surface membrane (also as we observed in this paper). All of these ROS-mediated events are facilitated by the original production of acetaldehyde since acetaldehyde inhibits both superoxide dismutase (SOD) and catalase (at 9), preventing the usual breakdown of the ethanol-generated ROS.

Comment in

References

    1. Assadi FK. Acute effect of ethanol on renal electrolyte excretion in rats. Alcohol 6: 257–260, 1989 - PubMed
    1. Bailey SM, Cunningham CC. Acute and chronic ethanol increases reactive oxygen species generation and decreases viability in fresh, isolated rat hepatocytes. Hepatology 28: 1318–1326, 1998 - PubMed
    1. Castellano E, Downward J. Role of RAS in the regulation of PI 3-kinase. Curr Top Microbiol Immunol 346: 143–169, 2010 - PubMed
    1. Castellano E, Downward J. RAS interaction with PI3K: more than just another effector pathway. Genes Cancer 2: 261–274, 2011 - PMC - PubMed
    1. Castellano E, Santos E. Functional specificity of ras isoforms: so similar but so different. Genes Cancer 2: 216–231, 2011 - PMC - PubMed

Publication types

MeSH terms

LinkOut - more resources