

Neighborhood income and stroke care and outcomes
- PMID: 22895592
- PMCID: PMC3440450
- DOI: 10.1212/WNL.0b013e31826aac9b
Neighborhood income and stroke care and outcomes
Abstract
Objective: To evaluate factors that may contribute to the increased stroke case fatality rates observed in individuals from low-income areas.
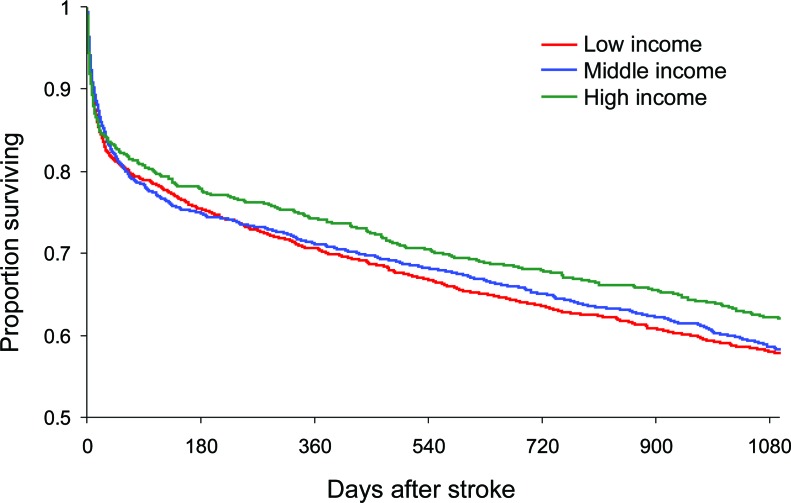
Methods: We conducted a cohort study on a population-based sample of all patients with stroke or TIA seen at 153 acute care hospitals in the province of Ontario, Canada, between April 1, 2002, and March 31, 2003, and April 1, 2004, and March 31, 2005. Socioeconomic status measured as income quintiles was imputed from median neighborhood income. In the study sample of 7,816 patients we determined 1-year mortality by grouped income quintile and used multivariable analyses to assess whether differences in survival were explained by cardiovascular risk factors, stroke severity, stroke management, or other prognostic factors.
Results: There was no significant gradient across income groups for stroke severity or stroke management. However, 1-year mortality rates were higher in those from the lowest income group compared to those from the highest income group, even after adjustment for age, sex, stroke type and severity, comorbid conditions, hospital and physician characteristics, and processes of care (adjusted hazard ratio for low- vs high-income groups, 1.18; 95 confidence interval 1.03 to 1.29).
Conclusions: In Ontario, 1-year survival rates after an index stroke are higher for those from the richest compared to the least wealthy areas, and this is only partly explained by age, sex, comorbid conditions, and other baseline risk factors.
Figures
Comment in
-
What is it about neighborhood characteristics that influence survival after a stroke or TIA?Neurology. 2012 Sep 18;79(12):1190-1. doi: 10.1212/WNL.0b013e31826aad8d. Epub 2012 Aug 15. Neurology. 2012. PMID: 22895594 No abstract available.
References
-
- Alter DA, Naylor CD, Austin P, Tu JV. Effects of socioeconomic status on access to invasive cardiac procedures and on mortality after acute myocardial infarction. N Engl J Med 1999;341:1359–1367 - PubMed
-
- Marmot MG. Status syndrome: a challenge to medicine. JAMA 2006;295:1304–1307 - PubMed
-
- Stjarne MK, Fritzell J, De Leon AP, Hallqvist J, for the SHEEP Study Group Neighborhood socioeconomic context, individual income and myocardial infarction. Epidemiology 2006;17:14–23 - PubMed
Publication types
MeSH terms
Grants and funding
LinkOut - more resources
Full Text Sources
Medical
Miscellaneous