. 2012 Aug 15;32(33):11213-27.
doi: 10.1523/JNEUROSCI.0521-12.2012.

TMEM106B, the risk gene for frontotemporal dementia, is regulated by the microRNA-132/212 cluster and affects progranulin pathways

Affiliations

TMEM106B, the risk gene for frontotemporal dementia, is regulated by the microRNA-132/212 cluster and affects progranulin pathways

Alice S Chen-Plotkin et al. J Neurosci. .

Abstract

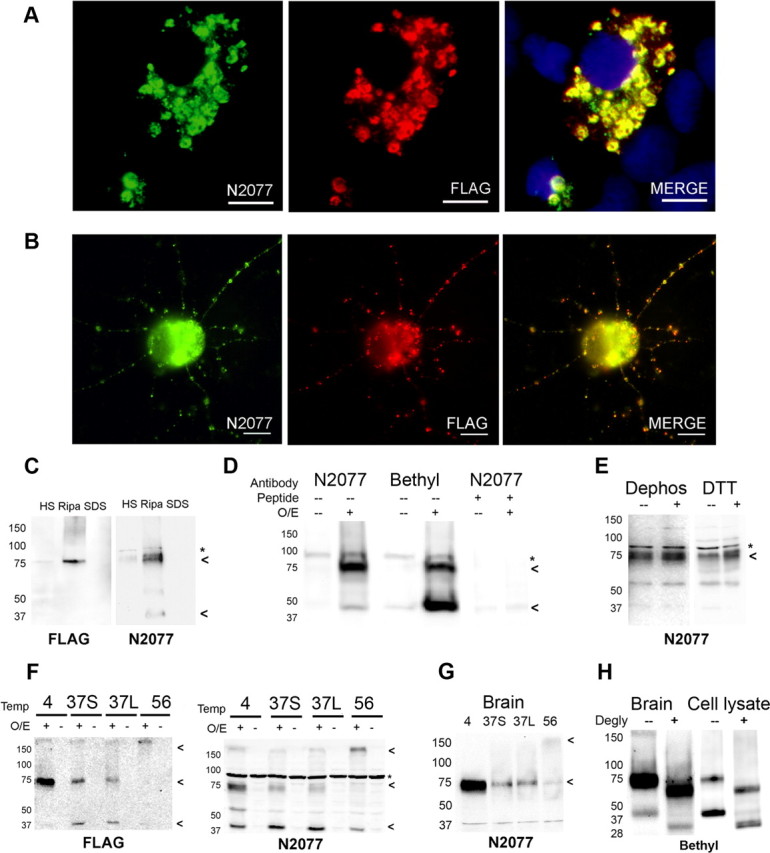
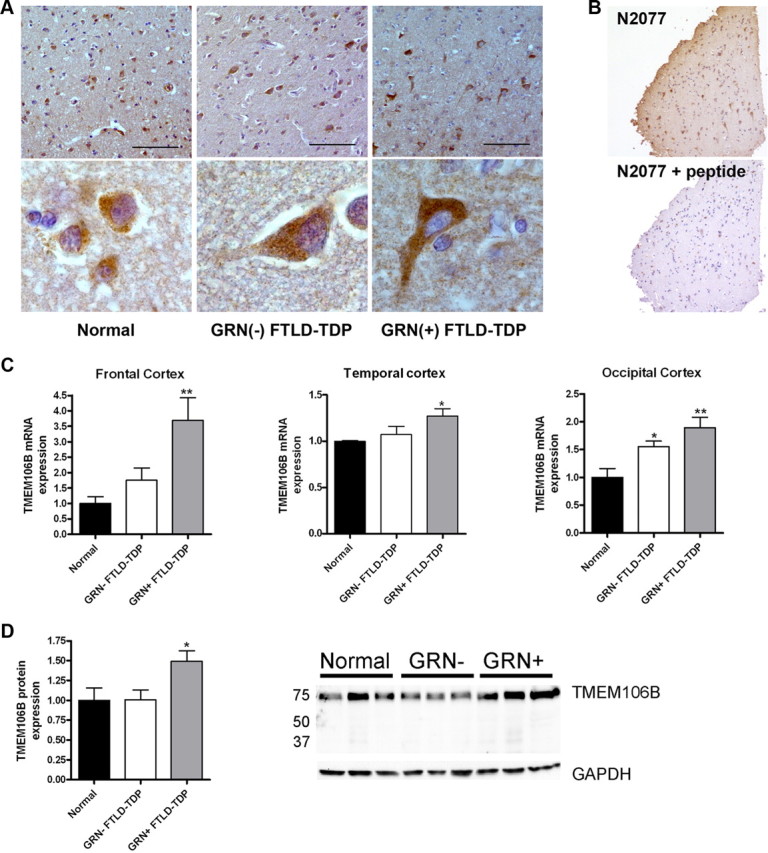
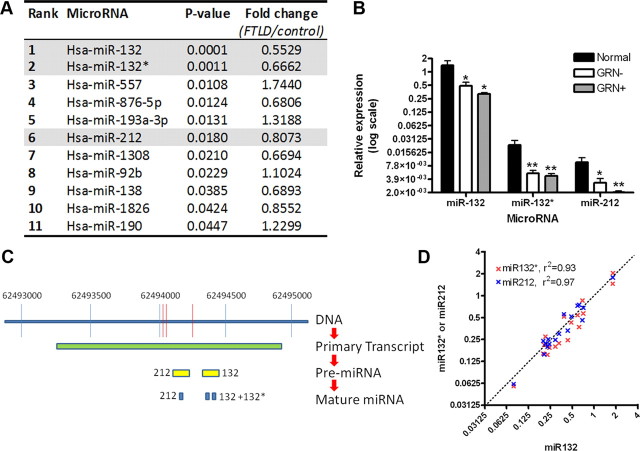
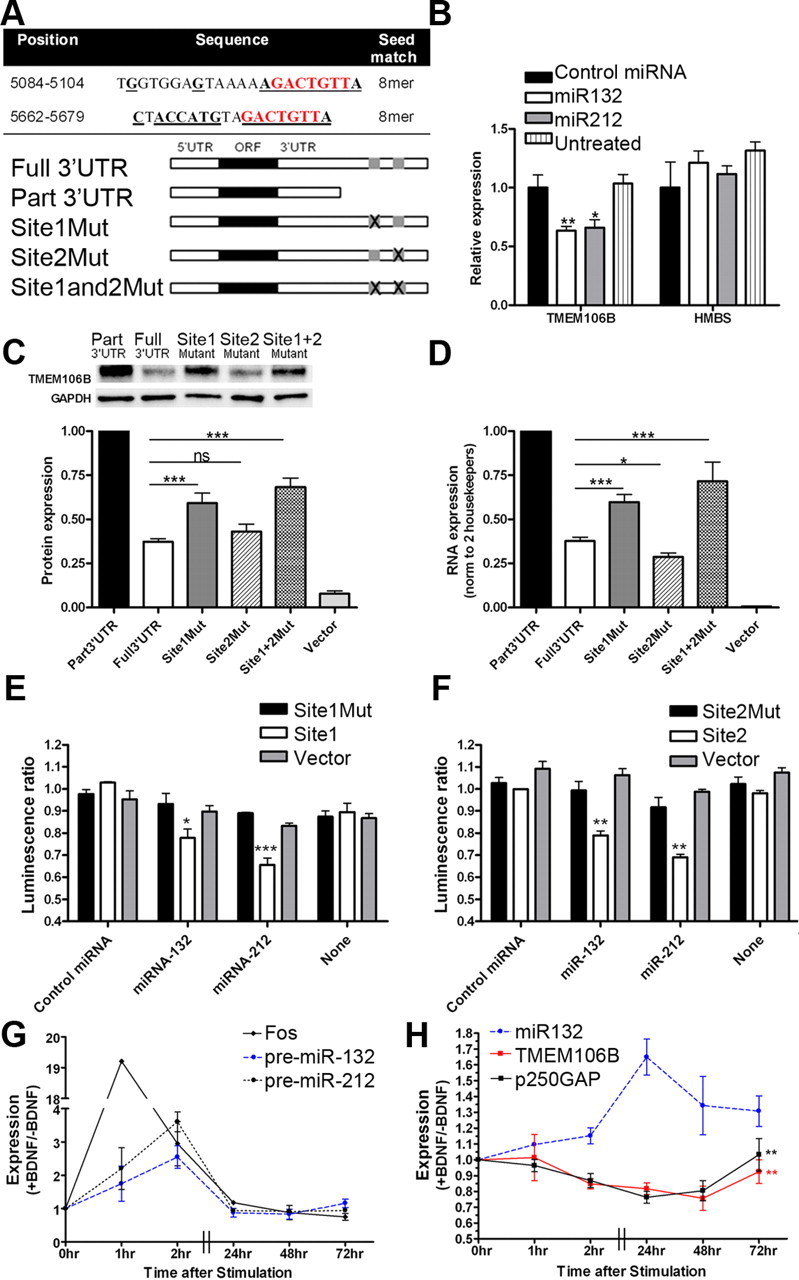
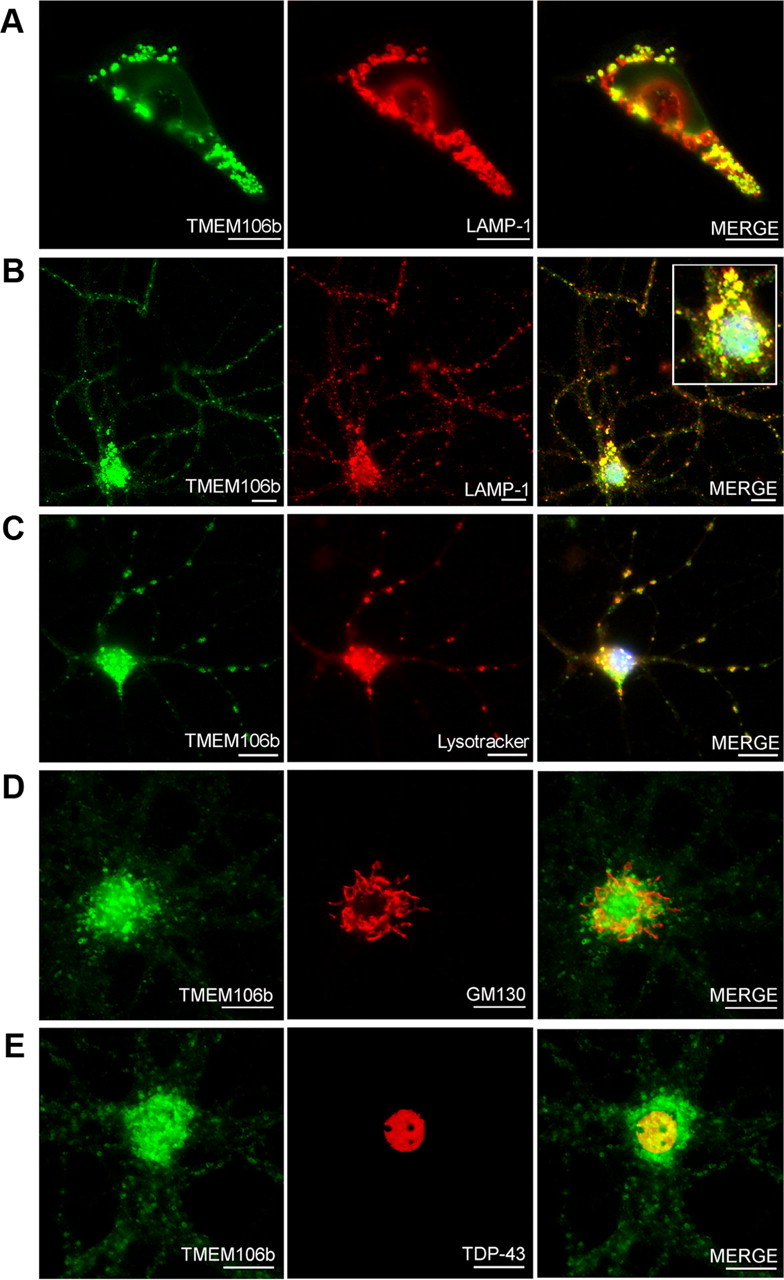
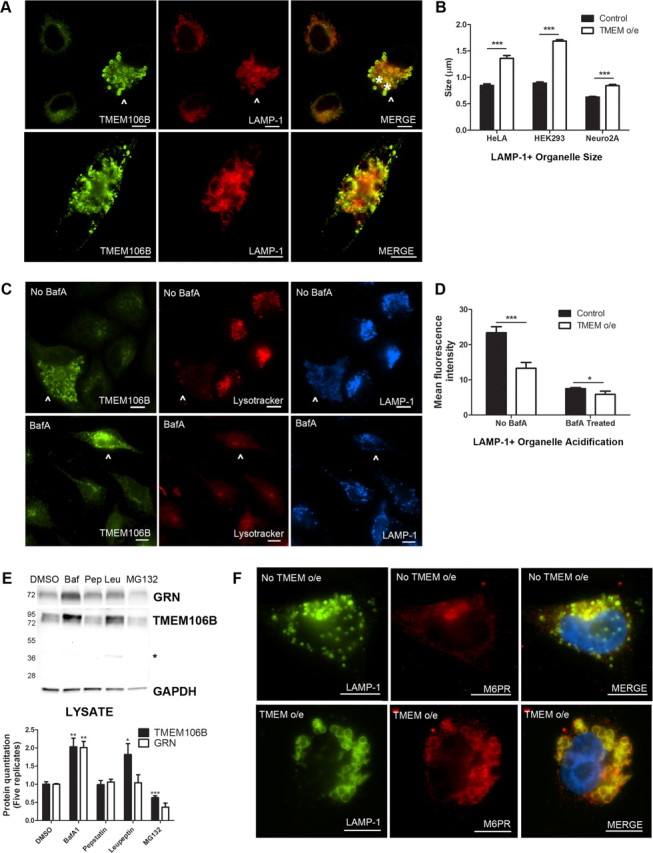
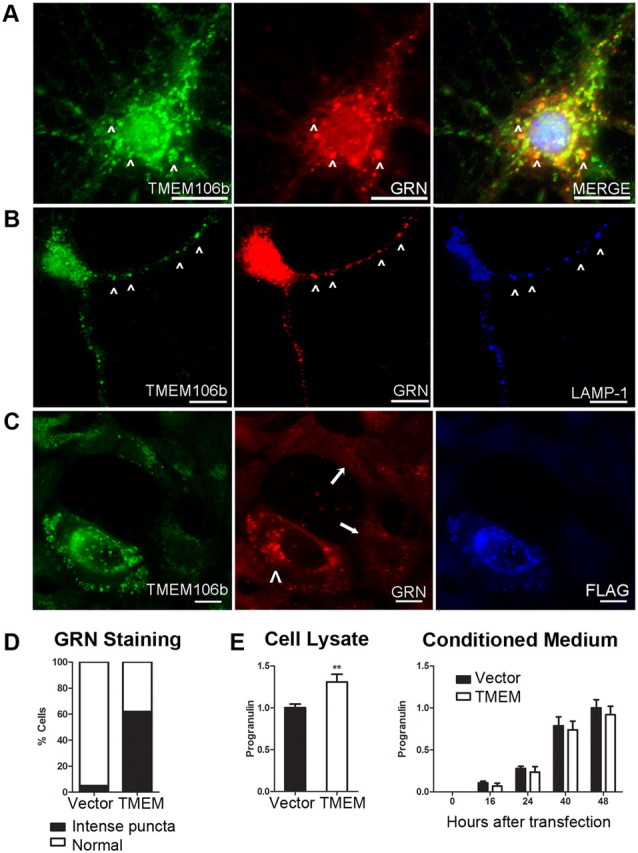
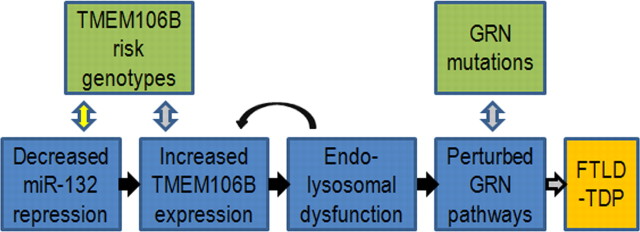
Frontotemporal lobar degeneration with TDP-43 inclusions (FTLD-TDP) is a fatal neurodegenerative disease with no available treatments. Mutations in the progranulin gene (GRN) causing impaired production or secretion of progranulin are a common Mendelian cause of FTLD-TDP; additionally, common variants at chromosome 7p21 in the uncharacterized gene TMEM106B were recently linked by genome-wide association to FTLD-TDP with and without GRN mutations. Here we show that TMEM106B is neuronally expressed in postmortem human brain tissue, and that expression levels are increased in FTLD-TDP brain. Furthermore, using an unbiased, microarray-based screen of >800 microRNAs (miRs), we identify microRNA-132 as the top microRNA differentiating FTLD-TDP and control brains, with <50% normal expression levels of three members of the microRNA-132 cluster (microRNA-132, microRNA-132*, and microRNA-212) in disease. Computational analyses, corroborated empirically, demonstrate that the top mRNA target of both microRNA-132 and microRNA-212 is TMEM106B; both microRNAs repress TMEM106B expression through shared microRNA-132/212 binding sites in the TMEM106B 3'UTR. Increasing TMEM106B expression to model disease results in enlargement and poor acidification of endo-lysosomes, as well as impairment of mannose-6-phosphate-receptor trafficking. Finally, endogenous neuronal TMEM106B colocalizes with progranulin in late endo-lysosomes, and TMEM106B overexpression increases intracellular levels of progranulin. Thus, TMEM106B is an FTLD-TDP risk gene, with microRNA-132/212 depression as an event which can lead to aberrant overexpression of TMEM106B, which in turn alters progranulin pathways. Evidence for this pathogenic cascade includes the striking convergence of two independent, genomic-scale screens on a microRNA:mRNA regulatory pair. Our findings open novel directions for elucidating miR-based therapies in FTLD-TDP.


Figures

Figure 1.
Figure 1.
TMEM106B antibody and protein characterization. We raised a novel polyclonal antibody (N2077) recognizing amino acids 4–19 of TMEM106B. A, B, HEK293 cells (A) or murine primary cortical neurons (B) were transfected with FLAG-tagged TMEM106B. Double-label immunofluorescence microscopy demonstrates that anti-FLAG antibody recognizes the same cellular structures as anti-TMEM106B antibody (N2077), demonstrating the specificity of our antibody in a cell biological context. C, HEK293 cells transfected with FLAG-tagged TMEM106B were sequential extracted into high-salt (HS), RIPA, and 2% SDS (SDS) buffers. A RIPA-soluble 75 kDa band was recognized by both anti-FLAG antibody and anti-TMEM106B antibody (N2077), demonstrating the specificity of our antibody in a biochemical context. D, TMEM106B overexpression in HEK293 cells resulted in the appearance of bands at 75 and 40 kDa, detected by both N2077 (first two columns) and a commercially available N-terminus antibody (Bethyl, middle two columns). Both bands disappeared when N2077 was preabsorbed with immunizing peptide (last two columns). O/E indicates whether TMEM106B was overexpressed (+) or not (−). Peptide indicates whether the antibody was preabsorbed with peptide immunogen (+) or not (−). E, Neither dephosphorylation with lambda phosphatase nor treatment with the reducing agent DTT changed the electrophoretic mobility of TMEM106B. Dephos, Dephosphorylated; DTT, DTT treated; (−), control; (+), treated condition. F, G, TMEM106B shows unusual heat sensitivity at temperatures above 4°C, even in the presence of protease inhibitors. In cell lysates from HEK293 cells transfected with FLAG-tagged TMEM106B (F), TMEM106B appeared primarily as a 75 kDa band when samples were kept on ice (4). When heated at 37°C for 30 min (37S) or 45 min (37L), the 75 kDa band faded, and a 40 kDa species began to appear. At higher temperatures (e.g., 56°C for 15 min, lane labeled 56), both the 40 and 75 kDa bands were lost and a >150 kDa aggregate appeared at the top of the gel. O/E indicates whether TMEM106B was overexpressed (+) or not (−). Blots were probed with both anti-FLAG and N2077 antibodies, demonstrating the specificity of the bands. Similar heat sensitivity was seen for TMEM106B extracted from human brain tissue from normal individuals (G). In contrast to HEK293 cell lysates, however, the 40 kDa band was never prominent in human brain samples. For all panels, samples were extracted into RIPA buffer, and equal amounts of protein were loaded into all lanes. H, TMEM106B from human brain samples (left) or overexpressed in HEK293 cells (right) was deglycosylated with PNGase F after short pretreatment at 37°C. The 75 and 40 kDa bands observed before deglycosylation (−) collapsed to lower-molecular-weight species of ∼60 and 31 kDa, respectively, after PNGase F treatment (+). Note that the predicted molecular weight of TMEM106B is 31 kDa. Blots probed with the Bethyl TMEM106B antibody. All immunoblots: arrowheads indicate TMEM106B species. *Nonspecific band.
Figure 2.
Figure 2.
TMEM106B expression is increased in FTLD-TDP. A, Immunohistochemical staining was performed with N2077 anti-TMEM106B antibody on frontal cortex brain sections from age-matched controls (Normal), GRN(−) FTLD-TDP, and GRN(+) FTLD-TDP). GRN(+) FTLD-TDP patients had more diffuse TMEM106B staining, extending throughout the cell body and into neuronal processes. Representative lower-magnification images (top) and higher-magnification images of typical neurons from the same field (bottom) are shown. Scale bar, 100 μm. B, Neuronal staining (top) was abolished with preabsorption of N2077 with the immunizing peptide (bottom). Scale bar, 200 μm. C, Total mRNA was isolated from neurologically normal controls (n = 6), GRN(−) FTLD-TDP (n = 7), and GRN(+) FTLD-TDP (n = 5), and TMEM106B transcript expression was measured by qRT-PCR in multiple brain regions. Compared with both normal controls and to GRN(−) FTLD-TDP, GRN(+) FTLD-TDP had significantly higher levels of TMEM106B expression. Means ± SEM are shown. *p < 0.05, **p < 0.01. D, Frontal cortex protein was RIPA extracted. Equal amounts of total protein from neurologically normal controls (n = 4), GRN(−) FTLD-TDP (n = 3), and GRN(+) FTLD-TDP (n = 4) were loaded, and immunoblots were probed for TMEM106B. Corroborating our mRNA findings, GRN(+) FTLD-TDP brain showed higher levels of TMEM106B protein expression. Quantification (mean ± SEM) includes all available samples; representative subset immunoblot is also shown.
Figure 3.
Figure 3.
The microRNA 132/212 cluster is decreased in FTLD-TDP. A, Frontal cortex samples from normal controls (n = 6) and patients with FTLD-TDP (n = 12) were evaluated by microarray for differentially expressed microRNAs. Eleven microRNAs demonstrated nominally significant differences in FTLD-TDP compared with controls, with microRNA-132 (miR-132) demonstrating the most significant association (p = 0.0001), and a decrease of ∼50% in FTLD-TDP. B, Confirmation of microarray screening results by qRT-PCR showed significant 65–75% reductions in miR-132, miR-132*, and miR-212 for FTLD-TDP frontal cortex samples from patients with (GRN+, n = 5) and without (GRN−, n = 7) progranulin mutations, compared with neurologically normal controls (n = 6). Absolute levels of miR-132, however, were 50–100 times higher than levels of either miR-132* or miR-212. Relative expression (mean ± SEM) of microRNAs are shown on a log2 scale, calibrated to one normal sample's miR-132 expression value. *p < 0.05, **p < 0.01. C, Three of the 11 microRNAs with differential expression in FTLD-TDP are known to arise from processing of the same CREB-responsive primary transcript. Specifically, a primary transcript on chromosome 17 gives rise to pre-miR-132 and pre-miR-212. Pre-miR-132 is then further processed to yield mature miR-132 and miR-132*, while pre-miR-212 yields mature mir-212. D, MiR-132 (x-axis), miR-132* (y-axis, red), and miR-212 (y-axis, blue) show highly correlated expression levels across all 18 human samples, suggesting that the observed decrease of all three microRNAs may be due to decreased expression of the shared primary transcript. For each miRNA, values are normalized to one sample within that group to account for the much higher expression levels of miR-132.
Figure 4.
Figure 4.
TMEM106B is regulated by miR-132 and miR-212. A, miR-132 and miR-212 are predicted to target the same mRNAs through a common seed region (nucleotides in red). The TMEM106B 3′UTR has two 8mer miR-132/miR-212 target sites at positions 5084 and 5662 (NM_001134232.1). Bolded, underlined nucleotides indicate regions of perfect complementarity between the TMEM106B 3′UTR and miR-132, which may have greater affinity than miR-212 for Site 2 of the TMEM106B 3′UTR through a stretch of complementarity outside the seed region. Constructs containing TMEM106B with the intact 3′UTR (full 3′UTR), or truncations or targeted deletions removing one or both miR-132/miR-212 sites, were used for experiments shown in C and D. B, Endogenous TMEM106B mRNA transcript is significantly reduced with addition of miR-132 or miR-212 mimics (mean ± SEM from four independent transfections). C, Compared with the truncated construct (part 3′UTR), protein levels of the TMEM106B construct containing both miR-132/212 binding sites (full 3′UTR) was decreased by 65%. Deletion of miR-132/212 Site 1 restored TMEM106B protein levels by ∼40%, while deletion of miR-132/212 Site 2 had minimal effect. Targeted deletions of both miR-132/212 binding sites (Site1Mut and Site2Mut) resulted in even greater restoration of TMEM106B expression. Representative immunoblot (top) and quantitation (mean ± SEM of five independent replicates) are shown. For TMEM106B constructs, only the 75 kDa band was apparent for cell lysates, which were always kept on ice. D, Corresponding TMEM106B mRNA levels (mean ± SEM of five independent replicates) for the same constructs. E, F, Luciferase reporters were generated containing TMEM106B 3′UTR miR-132/212 binding Site 1 (E) or Site 2 (F) with 5–10 flanking base pairs. Transfection of miR-132 or miR-212 resulted in significant decreases in reporter activity (mean ± SEM from three independent replicates) when either site was intact. No change was seen for reporters containing scrambled versions of the miR-132/miR-212 binding sites (Site1Mut and Site2Mut) or for reporters without miR-132 binding sites (Vector Laboratories). Luminescence ratio is the ratio between the firefly luciferase reporter under 3′UTR control and the constitutively active renilla luciferase reporter, controlling for differences in transfection efficiency. G, H, BDNF was applied to neuronally differentiated SHSY5Y cells to induce CREB-responsive genes. Pre-miR-132 and pre-miR-212, as well as the canonical CREB-responsive gene fos, were induced by BDNF within 1–2 h (Panel G). Mature miR-132 was maximally induced 24 h after BDNF treatment (H). Expression of the known miR-132 target gene p250GAP, as well as TMEM106B, decreased with BDNF treatment, with maximal repression at 48 h for TMEM106B. miR-132 levels had a significant effect on both TMEM106B (p = 0.009) and p250GAP (p = 0.006) expression. Ratios of BDNF-treated to nontreated conditions are shown for a minimum of four separate transfections. All panels: *p < 0.05, **p < 0.01, ***p < 0.001.
Figure 5.
Figure 5.
TMEM106B is associated with late endosomes/lysosomes in neurons. TMEM106b antibody N2077 was used for immunofluorescence microscopy. Scale bars, 10 μm. A, Structures staining with TMEM106B antibody (green) also expressed the late endosomal/lysosomal marker LAMP-1 (red) in HEK293 cells transiently transfected with TMEM106B. B, In nontransfected primary murine cortical neurons, endogenous TMEM106B (green) colocalized with LAMP-1 (red) in cell processes, and in the cell body (inset). C, In nontransfected primary murine cortical neurons, TMEM106B (green) colocalized with a marker for acidic organelles, Lysotracker (red), corroborating the association of TMEM106B with late endosomes/lysosomes. D, TMEM106B did not colocalize with the cis-Golgi marker GM130. E, TMEM106B did not colocalize with TDP-43.
Figure 6.
Figure 6.
Overexpression of TMEM106B results in abnormalities in the endosomal–lysosomal pathway. A, In HeLA cells overexpressing TMEM106B (arrowhead), LAMP-1+ organelles demonstrate a general increase in size, compared with neighboring cells not overexpressing TMEM106B. In addition, overexpression of TMEM106B also results in occasional formation of large vacuolar structures ∼5 μm in diameter (asterisks indicate two vacuolar structures in top panel, also pictured throughout the cytoplasm of cell in bottom panel). While these large vacuolar structures occur only occasionally with TMEM106B overexpression (the more typical finding is enlarged ∼1.5 μm LAMP-1+ organelles), they are not seen in the absence of TMEM106B overexpression. B, Similar results were obtained in HeLAs, HEK293 cells, and in the neuronal cell line Neuro2A. Size quantitation (mean ± SEM) was performed by measuring LAMP-1+ organelle diameter on >10 40× fields containing a mixture of cells with and without TMEM106B overexpression. Because the large vacuolar structures are only occasionally seen, they were not included in the quantitation. C, HeLA cells overexpressing TMEM106B (arrowhead) showed less intense staining with Lysotracker, a dye which demonstrates greater fluorescence at lower pH, than neighboring cells not overexpressing TMEM106B (top). This effect was abrogated by treatment of cells with bafilomycin A1, an inhibitor of the vacuolar ATPase, which resulted in diminished Lysotracker fluorescence for all cells (bottom). D, Quantitation of mean fluorescence intensity for cells overexpressing TMEM106B demonstrated that Lysotracker staining was significantly less intense than in neighboring cells with normal levels of TMEM106B expression. Quantitation (mean ± SEM) was performed on >10 40× fields containing a mixture of cells with and without TMEM106B overexpression. E, Immunoblot analysis of HeLA cells treated with the vacuolar ATPase inhibitor bafilomycin A1 (Baf) showed increased intracellular levels of TMEM106B and progranulin. Treatment with the lysosomal protease inhibitor leupeptin (Leu) increased levels of TMEM106B but did not affect levels of progranulin. Treatment with the lysosomal protease inhibitor pepstatin A (Pep) did not affect either protein, while treatment with the proteasome inhibitor MG132 decreased TMEM106B levels. Representative immunoblot (top) and quantitation of five replicate immunoblots (mean ± SEM, bottom) are shown. Asterisk indicates TMEM106B 40 kDa band only seen with leupeptin treatment. F, Under normal conditions, the cation-independent M6PR does not colocalize with LAMP-1. In cells overexpressing TMEM106B, M6PR colocalizes with LAMP-1 at the limiting membrane of enlarged LAMP-1+ organelles. *p < 0.05, **p < 0.01, ***p < 0.001. For all immunofluorescence panels, TMEM106B staining was performed with N2077. Scale bar, 10 μm.
Figure 7.
Figure 7.
Overexpression of TMEM106B alters the compartmentalization of progranulin. A–C, Immunofluorescence microscopy performed on cells stained for TMEM106B (N2077 antibody) and progranulin. Scale bar, 10 μm. A, B, Endogenous TMEM106B (green) in nontransfected primary murine cortical neurons colocalized with progranulin (GRN, red) in the cell body (A, arrowheads), and in processes (B, arrowheads). TMEM106B and GRN colocalized within late endosomes or lysosomes, as indicated by LAMP-1 staining (B, blue). C, Progranulin (GRN, red) appearance changed under conditions of TMEM106B overexpression. Progranulin formed intensely stained cytoplasmic puncta variably colocalizing with TMEM106B (green) only in HEK293 cells overexpressing FLAG-tagged TMEM106B (arrowhead). In the absence of TMEM106B overexpression, progranulin staining was much less intense (arrows). D, More than 60% of cells overexpressing TMEM106B showed intense cytoplasmic puncta of progranulin, compared with <5% of cells with normal levels of TMEM106B expression. Assessment of progranulin staining pattern performed on six 20× fields of HEK293 cells containing a mixture of cells with and without TMEM106B overexpression. E, Intracellular (left) and extracellular/secreted (right) pools of progranulin were measured by ELISA under conditions of TMEM106B overexpression (TMEM, white bars) versus vector transfection in HEK293 cells. Progranulin measurements (mean ± SEM for five experiments) were normalized to total protein in the cell lysate, to account for differential rates of cell growth. Overexpression of TMEM106B resulted in a 30% increase in intracellular progranulin, with a trend toward decreased extracellular progranulin. Intracellular progranulin is shown measured at 48 h after transfection of TMEM106B. Extracellular progranulin is shown at baseline and indicated time periods after transfection of TMEM106B. **p < 0.01.
Figure 8.
Figure 8.
Hypothetical model of causes and effects of TMEM106B overexpression in FTLD-TDP. Our data are compatible with a model whereby decreased levels of miR-132/212 result in increased TMEM106B expression. As a result, increased TMEM106B expression leads to (1) endosomal–lysosomal dysfunction, which may in turn further increase levels of TMEM106B, and also to (2) perturbation of progranulin pathways, thereby increasing the risk of developing FTLD-TDP. Black arrows indicate steps evidenced by the current study, gray arrows indicate steps reported in the literature, and yellow arrows indicate hypothetical steps.

References

    1. Arai T, Hasegawa M, Akiyama H, Ikeda K, Nonaka T, Mori H, Mann D, Tsuchiya K, Yoshida M, Hashizume Y, Oda T. TDP-43 is a component of ubiquitin-positive tau-negative inclusions in frontotemporal lobar degeneration and amyotrophic lateral sclerosis. Biochem Biophys Res Commun. 2006;351:602–611. - PubMed
    1. Baker M, Mackenzie IR, Pickering-Brown SM, Gass J, Rademakers R, Lindholm C, Snowden J, Adamson J, Sadovnick AD, Rollinson S, Cannon A, Dwosh E, Neary D, Melquist S, Richardson A, Dickson D, Berger Z, Eriksen J, Robinson T, Zehr C, et al. Mutations in progranulin cause tau-negative frontotemporal dementia linked to chromosome 17. Nature. 2006;442:916–919. - PubMed
    1. Benajiba L, Le Ber I, Camuzat A, Lacoste M, Thomas-Anterion C, Couratier P, Legallic S, Salachas F, Hannequin D, Decousus M, Lacomblez L, Guedj E, Golfier V, Camu W, Dubois B, Campion D, Meininger V, Brice A. TARDBP mutations in motoneuron disease with frontotemporal lobar degeneration. Ann Neurol. 2009;65:470–473. - PubMed
    1. Brown WJ, Constantinescu E, Farquhar MG. Redistribution of mannose-6-phosphate receptors induced by tunicamycin and chloroquine. J Cell Biol. 1984;99:320–326. - PMC - PubMed
    1. Capell A, Liebscher S, Fellerer K, Brouwers N, Willem M, Lammich S, Gijselinck I, Bittner T, Carlson AM, Sasse F, Kunze B, Steinmetz H, Jansen R, Dormann D, Sleegers K, Cruts M, Herms J, Van Broeckhoven C, Haass C. Rescue of progranulin deficiency associated with frontotemporal lobar degeneration by alkalizing reagents and inhibition of vacuolar ATPase. J Neurosci. 2011;31:1885–1894. - PMC - PubMed

Publication types

MeSH terms

LinkOut - more resources