. 2012 Aug 15;32(33):11377-89.
doi: 10.1523/JNEUROSCI.0415-12.2012.

Bidirectional plasticity of intrinsic excitability controls sensory inputs efficiency in layer 5 barrel cortex neurons in vivo

Affiliations

Bidirectional plasticity of intrinsic excitability controls sensory inputs efficiency in layer 5 barrel cortex neurons in vivo

Séverine Mahon et al. J Neurosci. .

Abstract

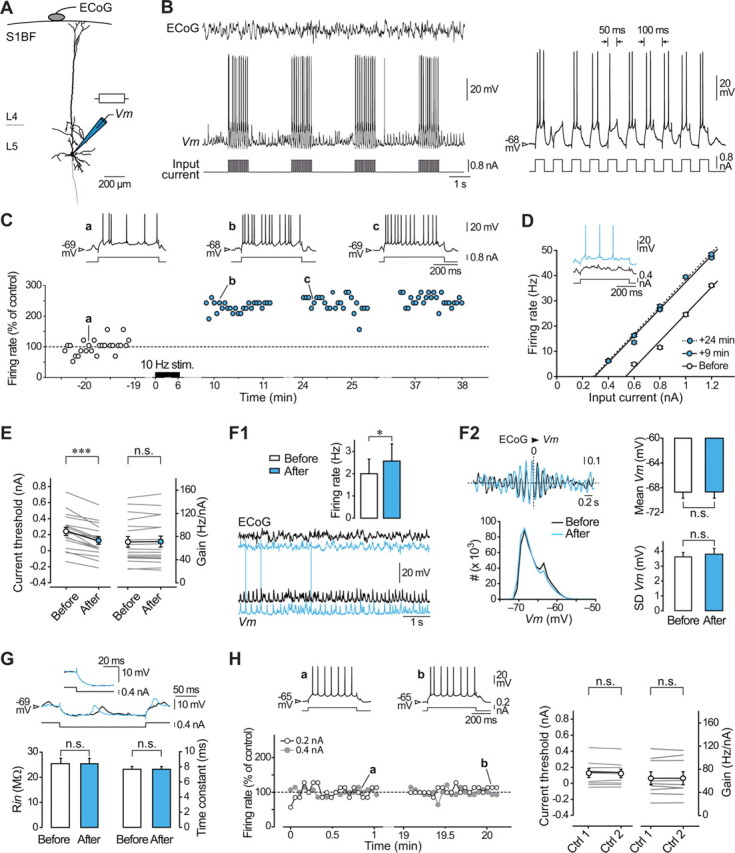
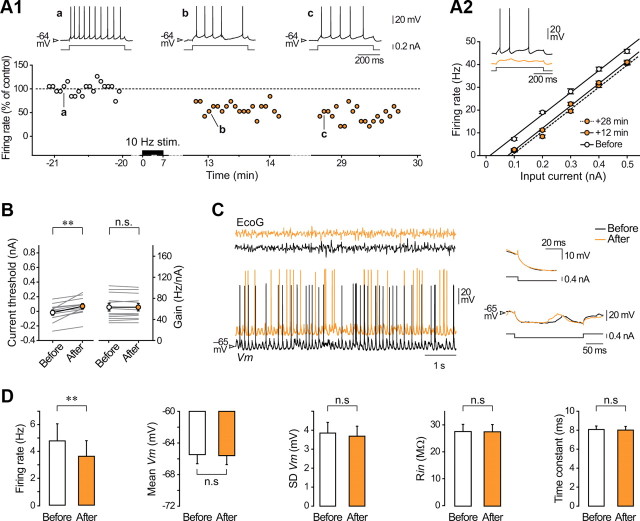
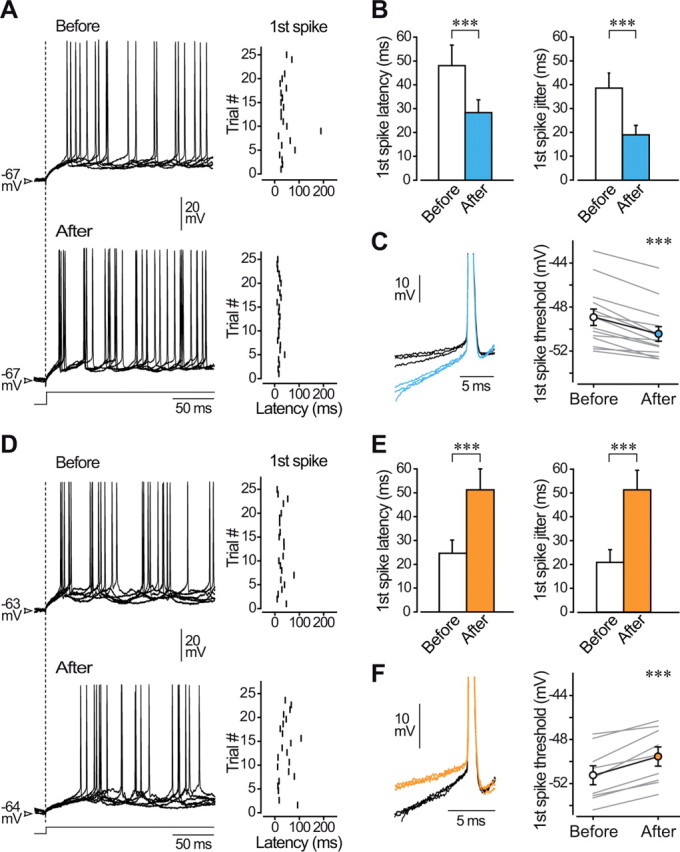
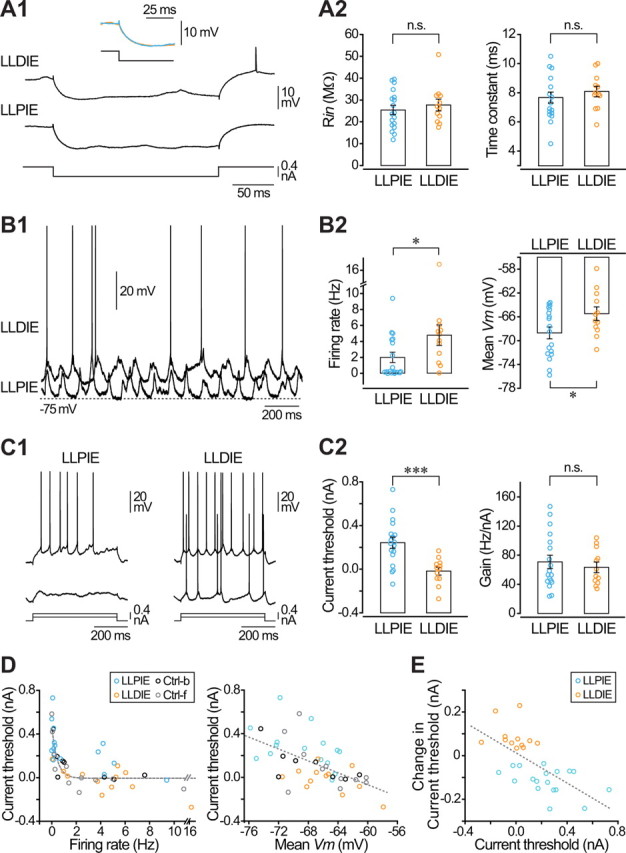
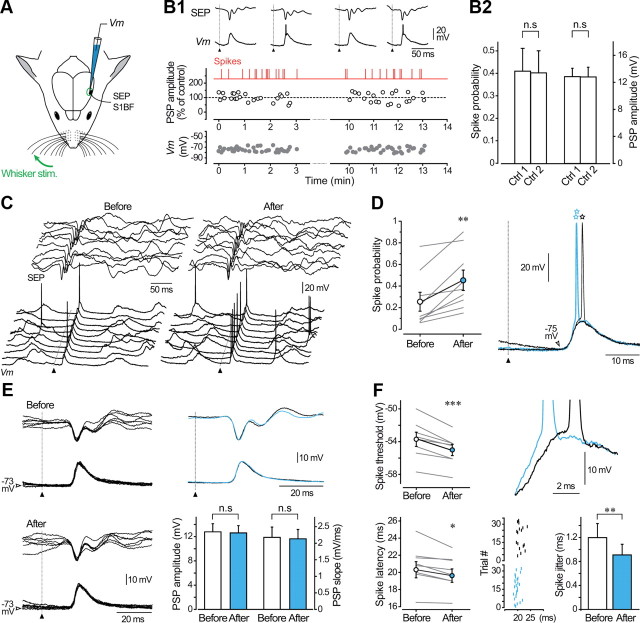
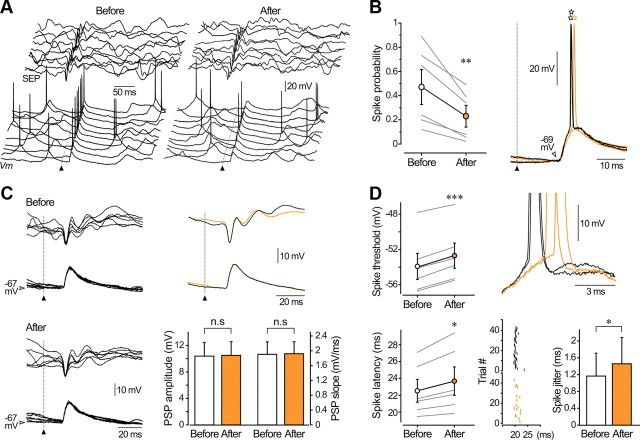
Responsiveness of cortical neurons to sensory inputs can be altered by experience and learning. While synaptic plasticity is generally proposed as the underlying cellular mechanism, possible contributions of activity-dependent changes in intrinsic excitability remain poorly investigated. Here, we show that periods of rhythmic firing in rat barrel cortex layer 5 pyramidal neurons can trigger a long-lasting increase or decrease in their membrane excitability in vivo. Potentiation of cortical excitability consisted of an increased firing in response to intracellular stimulation and a reduction in threshold current for spike initiation. Conversely, depression of cortical excitability was evidenced by an augmented firing threshold leading to a reduced current-evoked spiking. The direction of plasticity depended on the baseline level of spontaneous firing rate and cell excitability. We also found that changes in intrinsic excitability were accompanied by corresponding modifications in the effectiveness of sensory inputs. Potentiation and depression of cortical neuron excitability resulted, respectively, in an increased or decreased firing probability on whisker-evoked synaptic responses, without modifications in the synaptic strength itself. These data suggest that bidirectional intrinsic plasticity could play an important role in experience-dependent refinement of sensory cortical networks.


Figures

Figure 1.
Figure 1.
Activity-dependent long-lasting potentiation of intrinsic excitability in layer 5 pyramidal neurons in vivo. A, Reconstruction of a layer 5 pyramidal neuron of the rat barrel cortex (S1BF) filled with neurobiotin and recording configuration. ECoG was monitored during intracellular recording of Vm and intrinsic excitability was assessed in response to depolarizing and hyperpolarizing current pulses injected via the microelectrode. B, Simultaneous ECoG and intracellular recordings of a layer 5 pyramidal neuron during a portion of the conditioning protocol, which consisted in the injection of trains of suprathreshold current pulses every 3 s for 5–7 min. Right, Expanded record (first train in the left panel) showing that each train of stimulations was composed by 10 depolarizing current pulses of 50 ms duration applied at 10 Hz. C, Time course and magnitude of LLPIE in a representative potentiated neuron. Firing rate versus time evoked by a current pulse of constant amplitude (+0.8 nA), in control (white symbols) and after (blue symbols) application of the 10 Hz conditioning stimuli (10 Hz stim.). Changes in cell discharge are normalized to the mean control value (dashed line). The upper traces illustrate the current-evoked responses at the indicated times. Here and in subsequent figures, membrane potential values are indicated at the left of the records. D, F–I relationships and corresponding linear fits before and at the indicated times after induction. Each data point is the mean (±SEM) firing rate calculated from 25 successive trials (every 3.25 s). The current threshold was 0.54 nA before conditioning and decreased to 0.29 nA 24 min after induction. Inset, Single records showing that a previously subthreshold stimulus (black trace) became suprathreshold (blue trace) after induction. E, Summary data (n = 18 neurons) showing a significant decrease in current threshold values after conditioning while the neuronal gain remained unchanged. Here and in similar figures, gray lines indicate values for individual experiments and white/blue symbols show mean values ± SEM. F, Impact of LLPIE on spontaneous activity. F1, Typical recordings of spontaneous intracellular activity and corresponding ECoG waves, before (black traces) and after plasticity induction (blue traces). The inset shows average values (n = 18 neurons) of spontaneous firing rates before and during LLPIE. F2, Left, Corresponding cross-correlograms between ECoG and intracellular signals (computed from 10 s of recording; top) and Vm distributions (60 s of recording, bin size 1 mV; bottom) showing the stability of intensity and frequency of synaptic activities over time. Right, Pooled data (n = 18 neurons) comparing the mean and SD of Vm values in control and postinduction periods. G, As illustrated by the neuron responses to hyperpolarizing pulses of 0.4 nA (upper traces) in control (black trace) and during LLPIE (blue trace), membrane time constant and Rin were not significantly modified by the conditioning (bottom graphs). The inset is an expansion of the onset of voltage responses. H, Stability of intrinsic excitability in unconditioned neurons. Left, Time course of firing rate evoked by depolarizing current pulses of 0.2 nA (white symbols) and 0.4 nA (gray symbols) in a cortical neuron that was not challenged with the conditioning pulse-trains. The mean firing rates (normalized to the mean value of the first control period, dashed line) remained stable during the two control periods (p > 0.2 for each intensity tested). Examples of current-induced firing responses, recorded at the indicated times, are shown above the graph. Right, Population data (n = 9 neurons) showing the constancy of current threshold and gain values in control recordings. *p < 0.05; ***p < 0.001; n.s., nonsignificant. B–D and F all relate to the same neuron.
Figure 2.
Figure 2.
Long-lasting depression of intrinsic excitability in layer 5 pyramidal neurons in vivo. A, Time course and magnitude of plasticity in a barrel cortex neuron exhibiting LLDIE. A1, Long-lasting decrease in firing frequency in response to a depolarizing pulse of constant amplitude (0.2 nA) following a 7 min period of conditioning (10 Hz stim.). Changes in firing rate are expressed in percentage of the mean control value (dashed line). Evoked responses, obtained at the indicated times before and after conditioning, are shown on top. A2, Corresponding F–I curves constructed in control and after induction at the indicated times. Each symbol corresponds to the mean (±SEM) firing rate calculated from 20 successive (every 4.25 s) trials. Note the decrease in current threshold, from 0.013 nA to 0.09 nA 28 min after induction, without modification in the slope of F–I curves. Suprathreshold responses to depolarizing current injection of 0.1 nA could become subthreshold after conditioning (inset). B, Population analysis (n = 12 neurons) of current threshold and gain values before and after LLDIE induction. Gray lines show values for individual experiments and white/orange symbols indicate the corresponding mean values ± SEM, here and in similar figures. C, Left, Epochs of spontaneous intracellular and ECoG activities before (black traces) and after plasticity induction (orange traces). Right, Superimposition of individual and mean (12 successive trials, inset) voltage responses to negative current pulses delivered before and after conditioning. D, Summary data (n = 12 neurons) comparing average values of spontaneous firing rate, mean, and SD of Vm, Rin, and membrane time constant from control and postinduction periods. **p < 0.01; n.s., nonsignificant.
Figure 3.
Figure 3.
Long-lasting intrinsic plasticity alters firing properties. A, Six overlaid firing responses (the first 200 ms are illustrated) of a barrel cortex neuron to injection of current pulses (+0.4 nA, 500 ms) before (top traces) and during (bottom traces) LLPIE. The dashed line indicates the onset of the current injection. The corresponding raster plots of the first spikes (25 successive trials) are shown at right. B, Mean values of first spike latency and jitter before and after LLPIE induction (n = 18 neurons). C, DC superimposition of the first spikes evoked by current injection in control (black traces, n = 3) and after conditioning (blue traces, n = 3) showing that LLPIE was associated with an increase in the slope of membrane depolarization preceding the first action potential and with a lowered voltage spike threshold. Spikes are from records in A and truncated for convenience. Population analysis (right, n = 14 RS neurons) reveals a postconditioning decrease in the first spike threshold in all computed cells. D, Six overlaid firing responses of a barrel cortex neuron to injection of +0.2 nA current pulses before (top traces) and after (bottom traces) LLDIE induction. The corresponding raster plots of the first spikes (22 successive trials) are shown at right. E, Mean values of first spike latency and jitter before and after LLDIE induction (n = 12 neurons). F, DC superimposition of the first spikes evoked by current injection in control (black traces, n = 3) and after conditioning (orange traces, n = 3) showing that LLDIE was correlated with a decrease in the slope of the prespike voltage trajectory and with an augmented voltage spike threshold. Same cell as in D is used. Population analysis (right, n = 9 RS neurons) reveals a significant increase in the first spike threshold after induction. ***p < 0.001.
Figure 4.
Figure 4.
The sign of intrinsic plasticity correlates with baseline level of spontaneous discharge and excitability. A, Potentiated and depressed neurons exhibit similar passive membrane properties. A1, Average voltage responses (n ≥ 10) to hyperpolarizing (−0.4 nA) current pulses obtained during control periods in a potentiated (LLPIE) and a depressed (LLDIE) neuron. The inset is the superimposed expansion of the initial part of responses shown below. A2, Pooled data of control Rin and membrane time constant values from potentiated (n = 18) and depressed (n = 12) cells. B, Pyramidal neurons expressing LLPIE are more hyperpolarized and less active than neurons expressing LLDIE. B1, Representative epochs of spontaneous activity (1.5 s recordings) recorded during control periods in barrel cortex pyramidal neurons exhibiting either LLPIE or LLDIE after induction. B2, Corresponding summary data (18 potentiated and 12 depressed neurons) of baseline spontaneous firing rate and mean Vm. C, Current threshold is lower in neurons experiencing LLDIE. C1, Examples of control voltage responses in a potentiated and a depressed neuron to the injection of current pulses of same intensity. C2, Population data of control current threshold and gain in LLPIE (n = 18) and LLDIE (n = 12) neurons. D, Relationship between control current threshold values and baseline spontaneous firing rate (left) and mean membrane potential (right), for control cells recorded under barbiturate (Crtl-b, black symbols, n = 9), control cells under fentanyl (Ctrl-f, gray symbols, n = 11), and for neurons experiencing potentiation (LLPIE, blue symbols, n = 18) or depression (LLDIE, orange symbols, n = 12) of their excitability. Dashed gray lines are best curve fits. E, Population data (18 potentiated and 12 depressed neurons) showing that the bidirectional changes in threshold current after induction correlated well (r = −0.65) with the initial threshold current value. *p < 0.05; ***p < 0.001; n.s., nonsignificant.
Figure 5.
Figure 5.
The responsiveness of barrel cortex neurons to sensory inputs is enhanced during LLPIE. A, SEPs at the surface of the barrel cortex and related postsynaptic depolarizations in layer 5 pyramidal neurons (Vm) were recorded in response to air-puff stimuli applied to the contralateral whiskers (Whisker stim.). B, Stability of whisker-evoked sensory responses in unconditioned neurons. B1, Time course of membrane potential (measured 3 ms before the onset of the evoked potentials, Vm, gray symbols) and amplitude of evoked subthreshold PSPs (white symbols) during two consecutive control periods of stimulations. PSP amplitude is normalized to the mean value of the first control period. Red vertical lines indicate the occurrence of suprathreshold evoked responses. The onset of whisker stimulations is indicated by filled triangles here and in subsequent figures. The top traces show typical examples of subthreshold and suprathreshold intracellular responses together with related SEPs. B2, Summary plot showing that firing probability on evoked potentials and amplitude of subthreshold PSPs remained stable (p > 0.5 for both parameters) during control periods (n = 9 neurons). C, Ten successive whisker-evoked (20 psi) intracellular responses and corresponding SEPs obtained before and after LLPIE induction. Voltage calibrations applied to both series of traces. D, Population analysis (n = 9 neurons) comparing spike probability on sensory responses before and after the conditioning spike-trains. Right panel illustrates typical examples of whisker-evoked responses obtained in control (black traces) and after LLPIE (blue traces) clearly showing the enhanced firing probability and the decreased firing latency after induction (open stars). E, Superimposition (n = 6) of subthreshold PSPs and corresponding SEPs recorded in control and postinduction periods. Voltage calibrations applied to both series of traces. The corresponding average responses are superimposed at right. Pooled data (n = 9 neurons, bottom graph) indicate that amplitude and rising slope of subthreshold PSPs were not significantly modified (p > 0.5 for both parameters) by the intracellular conditioning. F, Population analysis (n = 8 neurons) showing that LLPIE was associated with a significant decrease in voltage threshold and latency of spikes on sensory-evoked PSPs (left part), as illustrated by the enlarged view of superimposed single responses from control (black trace) and postinduction periods (blue trace) shown at right. Bottom right, Raster plot obtained from a representative cortical neuron showing the time of occurrence of action potentials evoked by sensory stimuli before (black vertical lines, n = 17 trials) and during LLPIE (blue vertical lines, n = 27 trials). The bar graph shows that the temporal variability of spike latency is reduced after conditioning (n = 8 neurons). *p < 0.05; **p < 0.01; ***p < 0.001; n.s., nonsignificant. C–F are from the same neuron.
Figure 6.
Figure 6.
The responsiveness to sensory inputs is reduced in barrel cortex neurons experiencing LLDIE. A, Ten successive whisker-evoked (20 psi) intracellular responses and corresponding SEPs obtained before and after LLDIE induction. Voltage calibrations applied to both series of traces. B, Population analysis (n = 6 depressed neurons) comparing spike probability on sensory responses before and after the conditioning spike-trains. Right, Typical examples of whisker-related PSPs in control (black traces) and during LLDIE (orange traces) showing the increased firing latency (open stars) on sensory-evoked responses after induction. C, Superimposition (n = 6) of subthreshold PSPs and corresponding SEPs recorded in control and postinduction periods. Voltage calibrations applied to both series of traces. Corresponding average responses are superimposed at right. Pooled data (n = 6 neurons, bottom graph) showing that amplitude and rising slope of subthreshold PSPs were not significantly modified (p > 0.6 for both parameters) by the intracellular conditioning. D, Population analysis (left part, n = 6 neurons) showing that LLDIE was associated with an augmentation of voltage threshold and latency of spikes on evoked PSPs, as illustrated at right by the enlarged view of superimposed responses obtained in control (black traces) and postinduction periods (orange traces). Bottom right, Raster plot showing the time of occurrence of sensory-evoked action potentials before (black vertical lines, n = 40 trials) and after (orange vertical lines, n = 17 trials) LLDIE induction in a barrel cortex pyramidal neuron. The bar graph indicates that the temporal variability of spike latency is enhanced after conditioning (n = 6 neurons). *p < 0.05; **p < 0.01; ***p < 0.001; n.s., nonsignificant. A–D are from the same neuron.

Similar articles

Cited by

References

    1. Aizenman CD, Akerman CJ, Jensen KR, Cline HT. Visually driven regulation of intrinsic neuronal excitability improves stimulus detection in vivo. Neuron. 2003;39:831–842. - PubMed
    1. Azouz R, Gray CM. Dynamic spike threshold reveals a mechanism for synaptic coincidence detection in cortical neurons in vivo. Proc Natl Acad Sci U S A. 2000;97:8110–8115. - PMC - PubMed
    1. Bekisz M, Garkun Y, Wabno J, Hess G, Wrobel A, Kossut M. Increased excitability of cortical neurons induced by associative learning: an ex vivo study. Eur J Neurosci. 2010;32:1715–1725. - PubMed
    1. Bliss TV, Lomo T. Long-lasting potentiation of synaptic transmission in the dentate area of the anaesthetized rabbit following stimulation of the perforant path. J Physiol. 1973;232:331–356. - PMC - PubMed
    1. Brager DH, Johnston D. Plasticity of intrinsic excitability during long-term depression is mediated through mGluR-dependent changes in I(h) in hippocampal CA1 pyramidal neurons. J Neurosci. 2007;27:13926–13937. - PMC - PubMed

Publication types

LinkOut - more resources