. 2012 Aug 15;32(33):11495-504.
doi: 10.1523/JNEUROSCI.1737-12.2012.

In vivo reversible regulation of dendritic patterning by afferent input in bipolar auditory neurons

Affiliations

In vivo reversible regulation of dendritic patterning by afferent input in bipolar auditory neurons

Yuan Wang et al. J Neurosci. .

Abstract

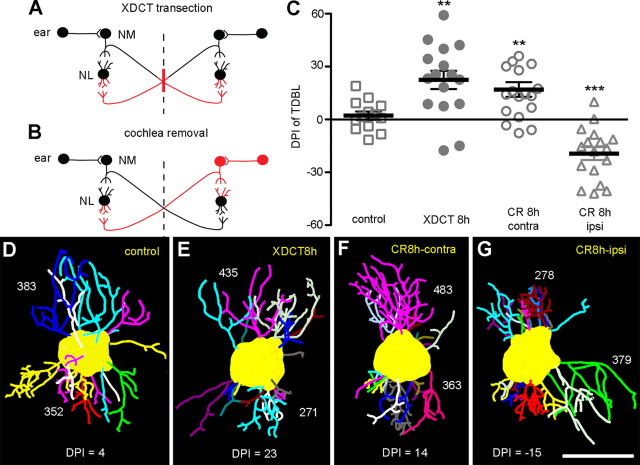
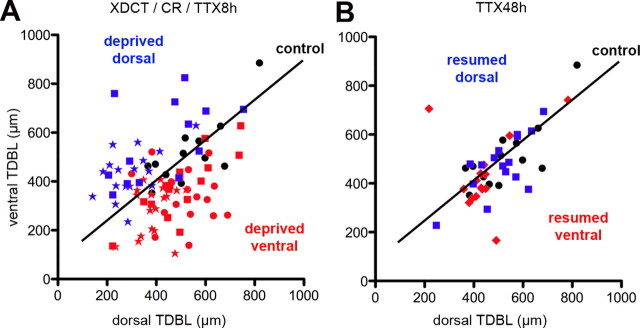
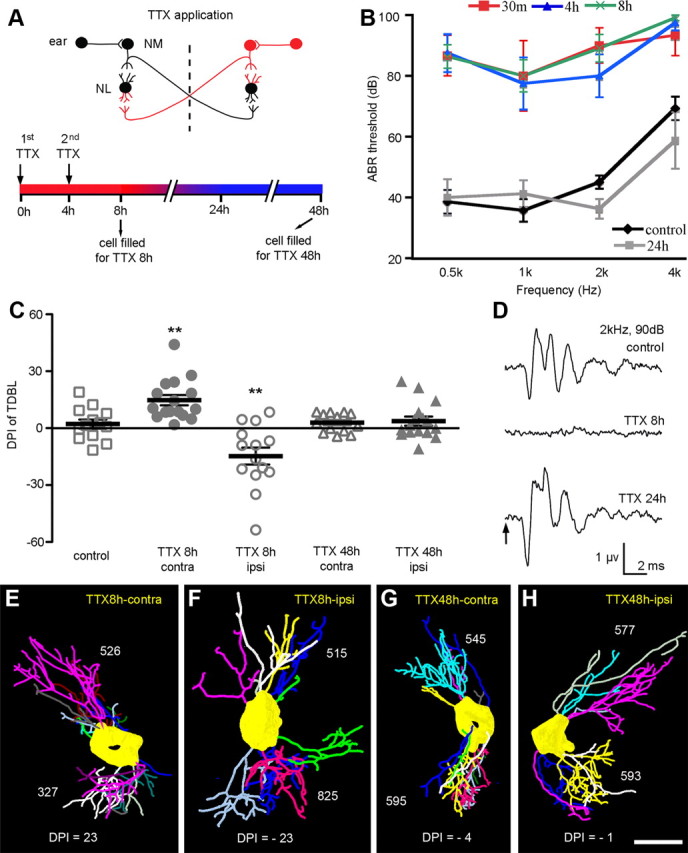
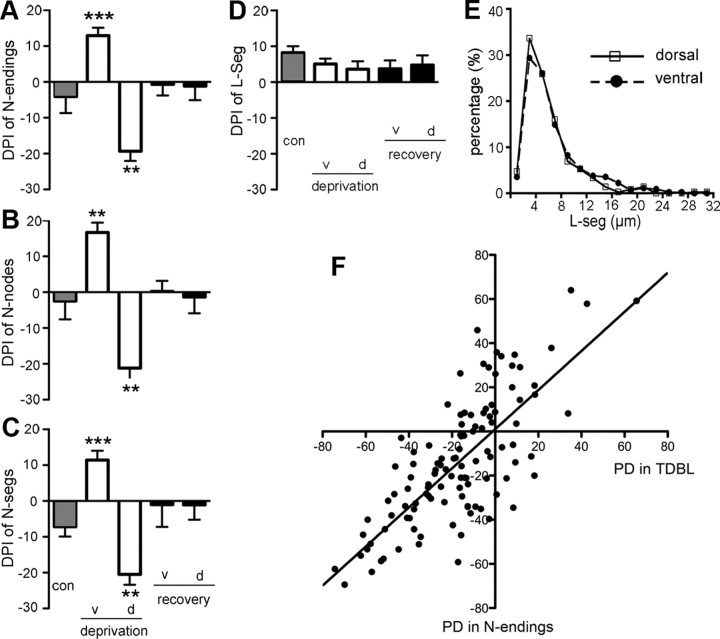
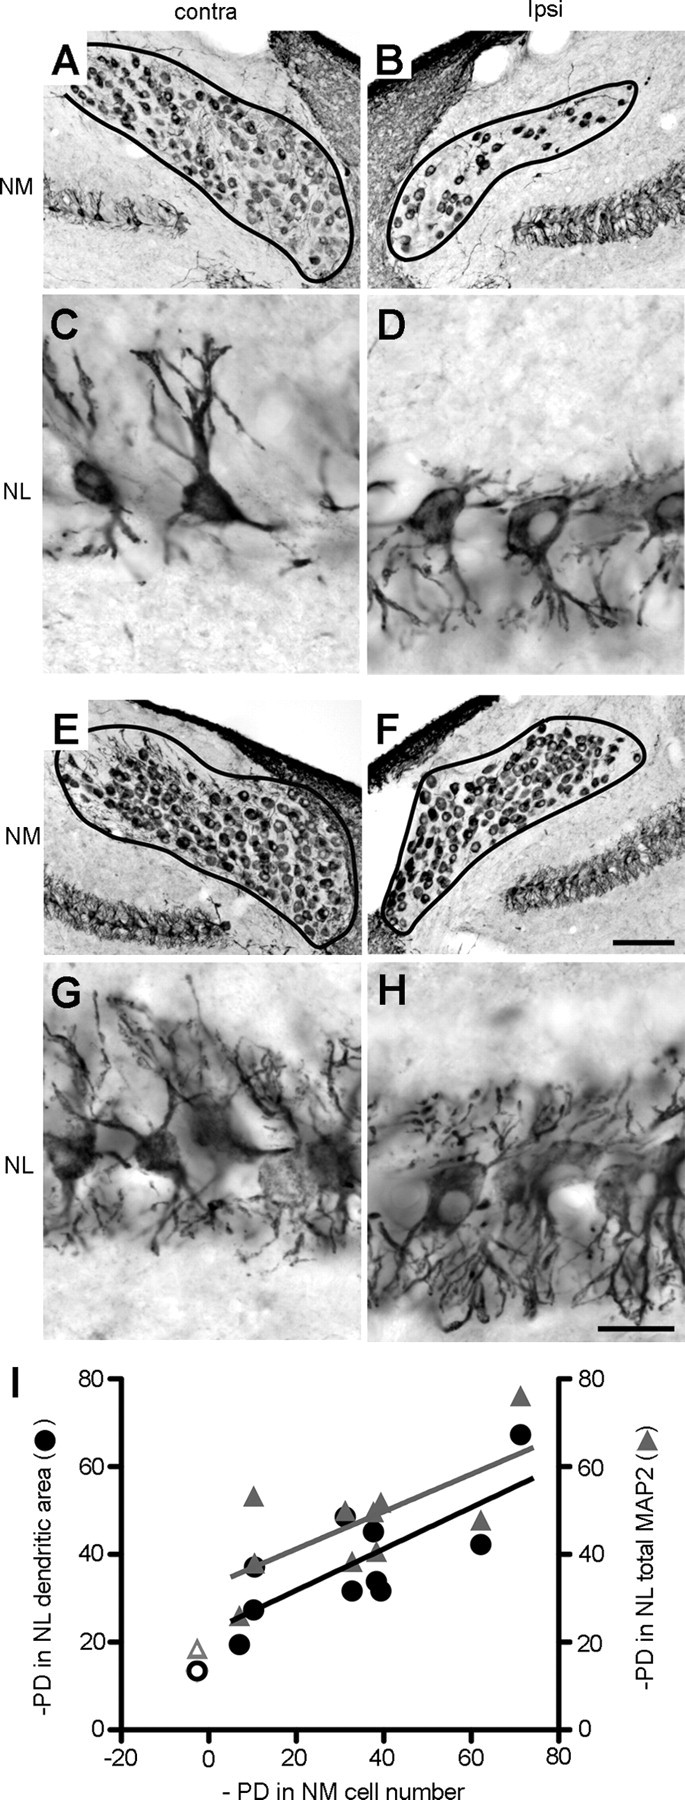
Afferent input regulates neuronal dendritic patterning locally and globally through distinct mechanisms. To begin to understand these mechanisms, we differentially manipulate afferent input in vivo and assess effects on dendritic patterning of individual neurons in chicken nucleus laminaris (NL). Dendrites of NL neurons segregate into dorsal and ventral domains, receiving excitatory input from the ipsilateral and contralateral ears, respectively, via nucleus magnocellularis (NM). Blocking action potentials from one ear, by either cochlea removal or temporary treatment with tetrodotoxin (TTX), leads to rapid and significant retraction of affected NL dendrites (dorsal ipsilaterally and ventral contralaterally) within 8 h compared with the other dendrites of the same neurons. The degree of retraction is comparable with that induced by direct deafferentation resulting from transection of NM axons. Importantly, when inner ear activity is allowed to recover from TTX treatments, retracted NL dendrites regrow to their normal length within 48 h. The retraction and growth involve elimination of terminal branches and addition of new branches, respectively. Examination of changes in NL dendrites at 96 h after unilateral cochlea removal, a manipulation that induces cell loss in NM and persistent blockage of afferent excitatory action potentials, reveals a significant correlation between cell death in the ipsilateral NM and the degree of dendritic retraction in NL. These results demonstrate that presynaptic action potentials rapidly and reversibly regulate dendritic patterning of postsynaptic neurons in a compartment specific manner, whereas long-term dendritic maintenance may be regulated in a way that is correlated with the presence of silent presynaptic appositions.


Figures

Figure 1.
Figure 1.
Photomicrographs of individual NL neurons visualized by cell filling in fixed sections. A, A neuron filled (cyan) in a section counterstained for immunoreactivity for the MAP2 (red). Cell filling and MAP2 staining reveal similar extensions of the dorsal and ventral dendrites. B, The distal portion of a filled NL neuron. NL dendrites have characteristic terminal morphologies with enlarged bulges with (green arrowheads; type 1) or without (red arrows; type 2) narrow filopodial-like extensions. A small percentage of endings does not have a distinct bulge (elongated yellow arrowheads; type 3). Dorsal is up and ventral is down. Image contrast, brightness, and gamma adjustments were made in Adobe Photoshop (Adobe Systems). Scale bars: A, 20 μm; B, 10 μm.
Figure 2.
Figure 2.
Effects of transection of the XDCT and unilateral cochlea removal (CR) on TDBL of NL neurons. A, B, Schematic drawings illustrate the surgical site for each manipulation and deprived axons and dendrites (red) influenced by each manipulation. Dashed lines indicate the midline. C, DPI of TDBL of individual NL neurons is plotted as a function of the manipulation at 8 h. Neurons whose ventral dendrites are deprived (XDCT 8h and CR 8h contra) exhibit significantly larger DPIs compared with control neurons, indicating significantly smaller TDBL in the ventral domain. The opposite is true for the neurons with deprived dorsal dendrites (CR 8h ipsi). Each data point (gray) represents an individual neuron. Mean and SEM are indicated by black bars for each group. The asterisks above individual groups indicate that the DPI of a manipulation group is significantly different (**p < 0.001; ***p < 0.0001) from the control group. D–G, 3D reconstructions of representative filled neurons in control (D) and after XDCT transection (E) and contralateral (F) and ipsilateral (G) cochlea removal. TDBL (micrometers) of each dendritic domain and DPI are indicated in the tracing for each neuron. Dorsal is up and ventral is down. Scale bar: (in G) D–G, 20 μm. contra, Contralateral; ips, ipsilateral.
Figure 3.
Figure 3.
Absolute TDBL values of analyzed neurons after manipulations. A, TDBL values of neurons after XDCT transection (red circles), unilateral cochlea removal (red and blue stars), and TTX treatment (red and blue squares) at 8 h compared with control neurons (black circles). B, TDBL values of neurons after TTX treatment (red and blue squares) at 48 h compared with control neurons (black circles). For both A and B, each data point represents an individual neuron. Neurons with manipulated dorsal and ventral dendrites are in red and blue, respectively. Solid black lines are linear regression of control neurons. Note that the majority of filled neurons are located in the rostral and middle portions of the nucleus and have a TDBL of 150–900 μm in one domain. One neuron filled on the ipsilateral side at 8 h after TTX treatment has TDBLd and TDBLv of 1162 and 1244 μm, respectively, and is not included in the graph.
Figure 4.
Figure 4.
Effects and time course of local TTX treatment on ABR and TDBL of NL neurons. A, Schematic drawings illustrate affected axonal and dendritic fields (red) after TTX treatment (top) and time course of TTX treatment and cell filling (bottom). Level of ABR activity is indicated along the time course with red and blue colors coding reduced or normal levels of activity, respectively. B, ABR threshold is plotted as a function of the frequency of sound stimulation. ABR thresholds increase dramatically at all examined frequencies at 30 min (red), 4 h (blue), and 8 h (green) and return to the control levels (black) by 24 h (gray). C, DPI of TDBL of individual NL neurons at 8 and 48 h after TTX treatment. Lack of afferent activity produces similar degrees and patterns of dendritic retraction in NL as cochlea removal during the first 8 h. These changes are reversed after 48 h on both sides of the brain. Each data point (gray) represents an individual neuron. Mean and SEM are indicated by black bars for each group. The asterisks above individual groups indicate that the DPI of a survival group is significantly different (**p < 0.001) from the control. D, Examples of ABR waveforms in response to 90 dB pure tone stimulation at 2 kHz in control, 8 and 24 h after TTX treatment. Arrow indicates the onset of stimulation. E–H, 3D reconstructions of representative filled neurons on the contralateral and ipsilateral sides at 8 h (E, F) and 48 h (G, H) after TTX treatment. TDBL (micrometers) of each dendritic domain and DPI are indicated in the tracing for each neuron. Dorsal is up and ventral is down. Scale bar: (in H) E–H, 20 μm. contra, Contralateral; ipsi, ipsilateral.
Figure 5.
Figure 5.
Dendritic complexity analyses. A–D, Changes in DPI of N-endings (A), N-nodes (B), and N-segs (C), as well as L-seg (D). Each neuron is presented as a single data point for these analyses. Neurons from animals that received XDCT transection, unilateral cochlea removal, or TTX treatment and survived for 8 h were grouped into two populations based on the domain of the deprived dendrites (open bars). Afferent deprivation leads to significant reductions in N-endings, N-nodes, and N-segs but does not appear to alter L-seg. The asterisks above individual groups indicate that the DPI of a particular group is significantly different (**p < 0.001; ***p < 0.0001) from the control. con, Control; v, ventral; d, dorsal. E, PD of L-seg in the dorsal and ventral domains of NL neurons after 8 h of TTX exposure. Data from five neurons on the right side (contralateral for TTX treatment) of the brain are averaged, separately for the dorsal and ventral domains. Neurons under this condition, as well as in the control and TTX 48 h groups (data not shown), show similar distribution of segment length between the dorsal and ventral domains. F, Correlations of changes in N-endings, with changes in TDBL after manipulations. Each neuron is presented as a single data point. Solid line indicates the linear regression (r2 = 0.58, p < 0.0001). Neurons with larger PDs in TDBL tend to have larger PDs in N-endings.
Figure 6.
Figure 6.
Correlation of cell survival in NM with dendritic maintenance in NL at 4 d after unilateral cochlea removal. A–H, Photomicrographs of coronal sections labeled with MAP2 immunoreactivity through NM (A, B, E, and F) and NL (C, D, G, and H). A–D were taken from one animal and E–H from a second animal. Left (A, C, E, G) and right (B, D, F, H) columns are from the contralateral and ipsilateral sides, respectively. In both cases, the ipsilateral NM has a notable reduction in cell number compared with the contralateral NM of the same case. Within NL, the ventral dendrites of the contralateral side and the dorsal dendrites of the ipsilateral side show clear retraction compared with the other domain of the same side. The difference between the two cases is that the first case (A–D) exhibits a much larger degree of cell death in the ipsilateral NM (72%) compared with the second case (E–H; 11%). Correlated to this difference in transneuronal NM cell death, dendritic retractions in NL are more dramatic in the first case than in the second case. Solid lines in A, B, E, and F outline the borders of NM. Images of NL in C, D, G, and H are rotated such that dorsal is up and ventral is down. Caudorostral level of these photomicrographs are ∼60% in NM and 50% in NL along the caudal-to-rostral axis, corresponding to a characterized frequency of 2 kHz. I, PDs in dendritic area (black circle) and total MAP2 immunoreactivity (gray triangle) of the contralateral NL are plotted as a function of PDs in neuronal cell number between the ipsilateral and contralateral NM. Each data point represents an individual animal. Open symbols are the average from control animals. Cases with larger PDs in NM cell number tend to have larger PDs in dendritic area and total MAP2 staining in NL. Image contrast, gamma, and brightness adjustments were made in Adobe Photoshop. Scale bars: (in F) A, B, E, F, 100 μm; (in H) C, D, G, H, 20 μm. contra, Contralateral; ipsi, ipsilateral.

Similar articles

Cited by

References

    1. Abercrombie M. Estimation of nuclear population from microtome sections. Anat Rec. 1946;94:239–247. - PubMed
    1. Benes FM, Parks TN, Rubel EW. Rapid dendritic atrophy following deafferentation: an EM morphometric analysis. Brain Res. 1977;122:1–13. - PubMed
    1. Born DE, Rubel EW. Afferent influences on brain stem auditory nuclei of the chicken: neuron number and size following cochlea removal. J Comp Neurol. 1985;231:435–445. - PubMed
    1. Born DE, Rubel EW. Afferent influences on brain stem auditory nuclei of the chicken: presynaptic action potentials regulate protein synthesis in nucleus magnocellularis neurons. J Neurosci. 1988;8:901–919. - PMC - PubMed
    1. Born DE, Durham D, Rubel EW. Afferent influences on brainstem auditory nuclei of the chick: nucleus magnocellularis neuronal activity following cochlea removal. Brain Res. 1991;557:37–47. - PubMed

Publication types

MeSH terms

LinkOut - more resources