. 2012 Oct;5(10):1236-46.
doi: 10.1158/1940-6207.CAPR-12-0234. Epub 2012 Aug 15.

Energy balance modulates mouse skin tumor promotion through altered IGF-1R and EGFR crosstalk

Affiliations

Energy balance modulates mouse skin tumor promotion through altered IGF-1R and EGFR crosstalk

Tricia Moore et al. Cancer Prev Res (Phila). 2012 Oct.

Abstract

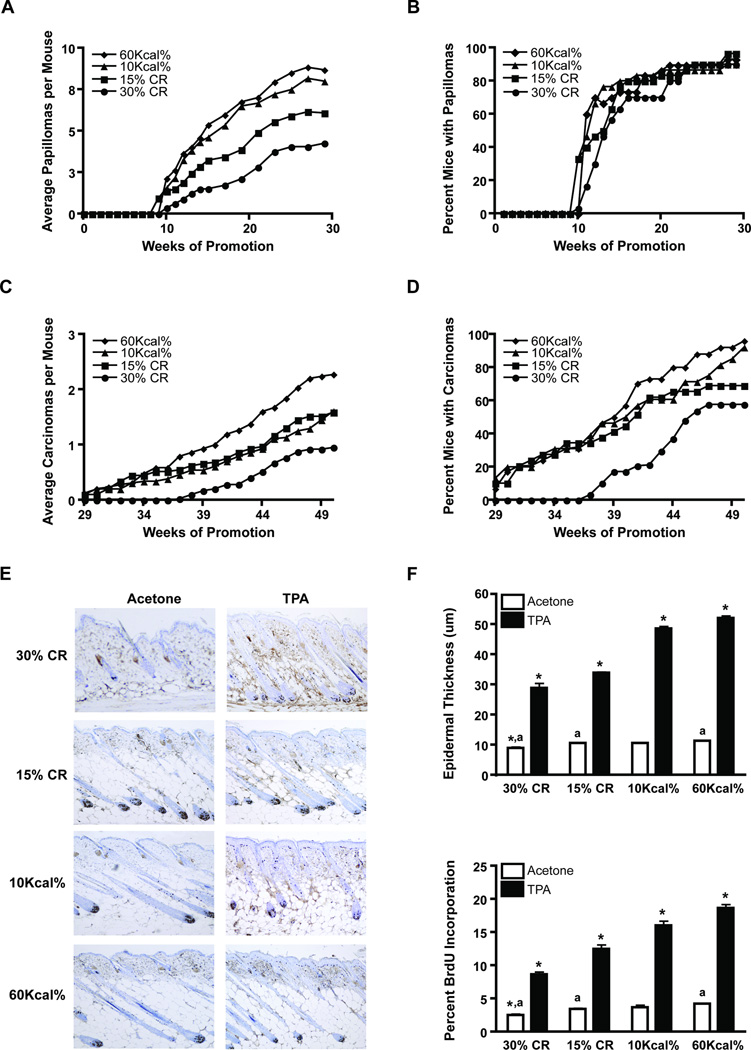
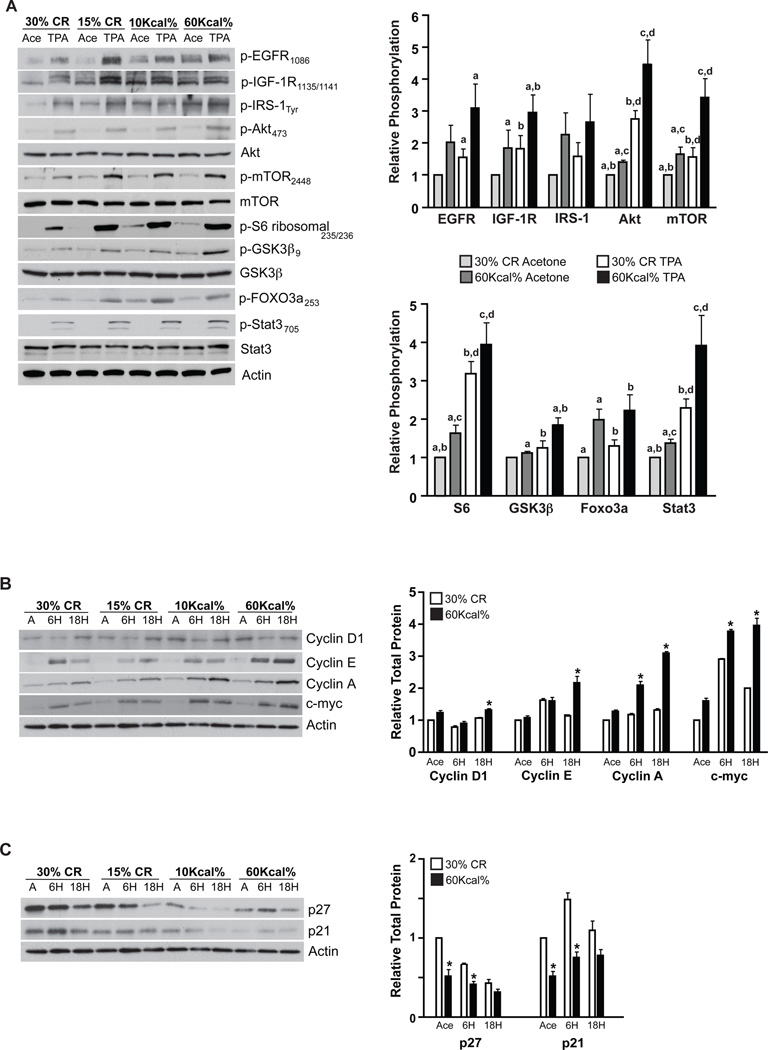
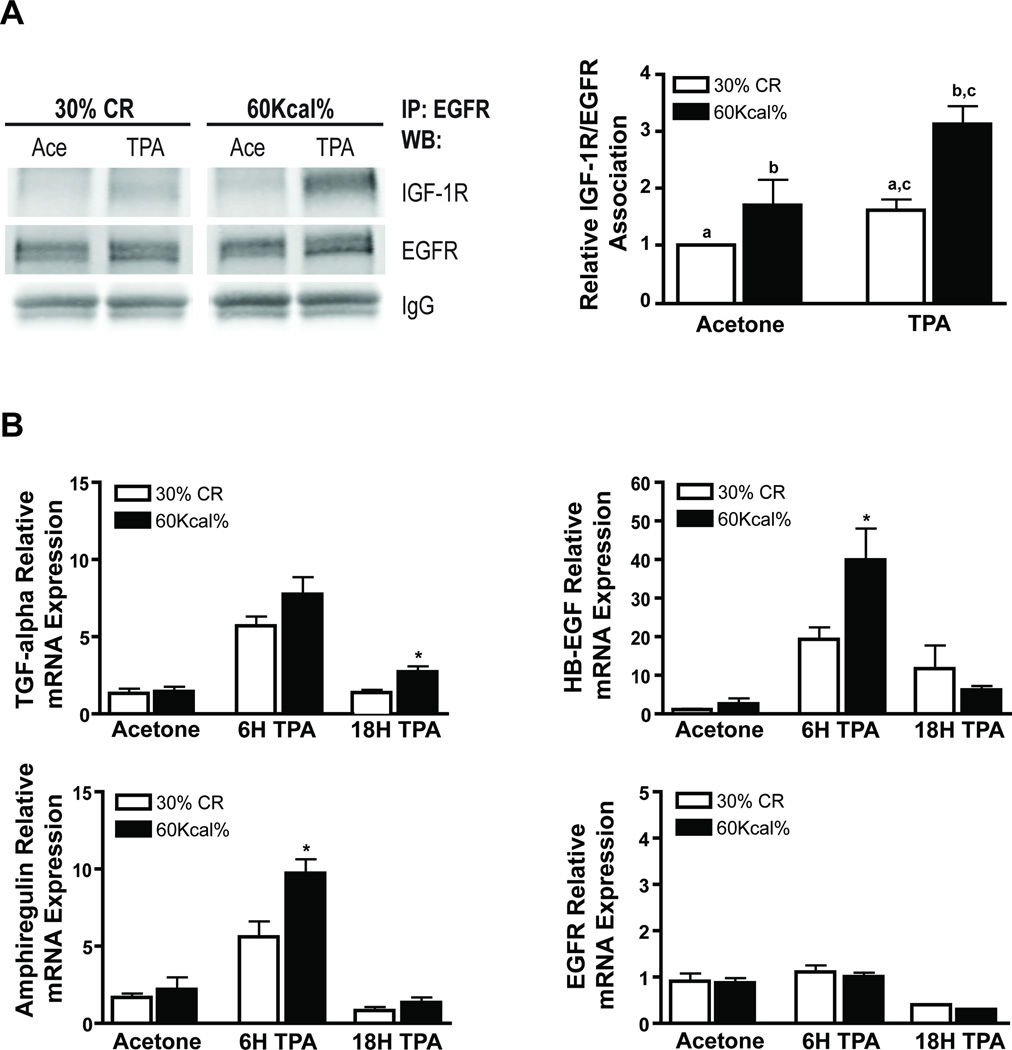
Obesity, an established risk factor for epithelial cancers, remains prevalent in the United States and many other countries. In contrast to positive energy balance states (overweight, obesity), calorie restriction (CR) has been shown to act as a universal inhibitor of tumorigenesis in multiple animal models of human cancer. Unfortunately, the mechanisms underlying the enhancing effects of obesity or the inhibitory effects of CR on cancer etiology remain elusive. Here, we evaluated the impact of dietary energy balance manipulation on epithelial carcinogenesis and identified several potential mechanisms that may account for the differential effects of obesity and CR on cancer. Obesity enhanced tumor promotion during epithelial carcinogenesis, in part, due to altered insulin-like growth factor-1 receptor (IGF-1R)/EGF receptor (EGFR) crosstalk and downstream signaling to effectors such as Akt/mTOR. Obesity-induced changes in cellular signaling subsequently led to altered levels of cell-cycle proteins that favored enhanced epidermal proliferation during tumor promotion. In contrast, CR reduced susceptibility to tumor promotion, attenuated IGF-1R/EGFR crosstalk and downstream signaling, and altered levels of cell-cycle proteins that favored reduced epidermal proliferation during tumor promotion. Collectively, these findings suggest potential targets for the prevention of epithelial cancers, as well as for reversal of obesity-mediated cancer development and progression. Cancer Prev Res; 5(10); 1236-46. ©2012 AACR.


Conflict of interest statement

There are no conflicts of interest.

Figures

Figure 1
Figure 1
Effect of dietary energy balance on two-stage skin carcinogenesis and TPA-induced epidermal proliferation. Two-stage skin carcinogenesis was conducted using lean (30% CR), normal (15% CR), overweight control (10 Kcal% fat) and obese (60 Kcal% fat) mice (n=30/group). A, Tumor multiplicity. CR (30%, 15%) significantly reduced tumor multiplicity (p < 0.05; Mann-Whitney U test); B, Tumor incidence; C, Average carcinomas per mouse. 30% CR significantly reduced, while DIO (60 Kcal%) significantly increased the average number of carcinomas per mouse (p < 0.05; Mann-Whitney U test); D, Carcinoma incidence. CR (30%, 15%) significantly reduced carcinoma incidence (p < 0.05; χ2 test). E-F, ICR female mice were maintained on the four diets for 15 weeks and were treated with either acetone (white bars) or 3.4 nmol TPA (black bars), twice weekly for two weeks (n=3/group). E, Representative BrdU stained skin sections; F, Epidermal thickness (upper) and percent BrdU incorporation (lower). *Statistically different from all similarly treated groups; a significantly different from similarly labeled values (p < 0.05; Mann-Whitney U test).
Figure 2
Figure 2
Effect of dietary manipulation on growth factor signaling and cell cycle regulatory proteins in epidermis following treatment with TPA. ICR female mice maintained on the four diets for 15 weeks were treated with a single application of acetone or 3.4 nmol TPA and killed 6 hours (growth factor signaling, cell cycle) or 18 hours (cell cycle) after treatment (n=6). Epidermal lysates were pooled for Western blot analyses. A, Growth factor signaling changes in epidermis 6 hours after TPA treatment (left) and densitometry graph representing mean ± SEM of three independent experiments (right) (30% CR acetone, light grey bars; 60Kcal% acetone, dark grey bars; 30% CR TPA, white bars; 60Kcal% TPA, black bars). Western blot data was normalized to both actin and total protein. a–d Significantly different from similarly labeled values (p < 0.05; Student’s t-test). B, Changes in positive and C, Changes in negative cell cycle regulatory proteins at 6 and 18 h following TPA treatment. Densitometry quantitation graphs (shown to the right of the Western blots in B and C represent mean ± SEM of three independent experiments (30% CR, white bars; 60Kcal%, black bars) in which Western blot data was normalized to actin. *Significantly different from the corresponding time point (p < 0.05; Student’s t-test).
Figure 3
Figure 3
Effect of IGF-1 and EGF on receptor activation in keratinocytes. C50 cells were serum and growth factor starved for 24 hours, stimulated with either IGF-1 (25 ng/mL) or EGF (10 ng/mL) and harvested at multiple time points (0–120 minutes). A, Western blot analyses evaluating EGFR, erbB2 and IGF-1R activation in cell lysates. B, Quantitation. Data shown represents mean ± SEM of three independent experiments (IRS-1, white bars; EGFR, black bars; erbB2, gray bars). IGF-1 stimulation significantly increased activation of all targets at all time points, while EGF stimulation significantly increased EGFR and erbB2 activation at all time points (p < 0.05; Student’s t-test).
Figure 4
Figure 4
Effect of IGF-1 and EGF on IGF-1R/EGFR association and EGFR ligand mRNA levels. C50 cells were cultured and harvested as described in Figure 4 and lysate was prepared for co-immunoprecipitation experiments and mRNA expression analyses. A, Effect of IGF-1 and EGF stimulation on IGF-1R/EGFR association. Right panel shows relative quantitation of mean ± SEM of three independent experiments (IGF-1, white bars; EGF, black bars). EGFR and IGF-1R were normalized to IgG and then to each other. *Denotes significant increase in IGF-1R/EGFR association, relative to the 0 time point (p < 0.05; Student’s t-test). B, Effect of IGF-1 (white bars) and EGF (black bars) stimulation on EGFR and EGFR ligand (TGF-α, HB-EGF, Amphiregulin, and EGFR) mRNA expression by qPCR analysis. Data shown represents mean ± SEM of three independent experiments. *Significant increase in EGFR ligand mRNA expression following EGF stimulation; **Significant increase in EGFR ligand mRNA following both IGF-1 and EGF stimulation (p < 0.05; Student’s t-test).
Figure 5
Figure 5
Effect of dietary manipulation on IGF-1R/EGFR heterodimerization and EGFR and EGFR ligand mRNA expression. ICR female mice were maintained on a 30% CR (white bars) and 60Kcal% fat (black bars) diet and treated with TPA as described in Figure 2 (n=6). Epidermal lysates were pooled and prepared for co-immunoprecipitation experiments and qPCR analysis. A, Co-immunoprecipitation with EGFR and subsequent Western blot analyses for EGFR and IGF-1R (left panel); representative densitometry graph (right panel). EGFR and IGF-1R were normalized to IgG and then to each other. Data shown represents mean ± SEM of three independent experiments. a–c Values with the same lettering indicate statistically significant differences (p < 0.05, Student’s t-test). B, qPCR analysis of EGFR and the EGFR ligands TGF-α, HB-EGF, Amphiregulin, and EGFR. Data represents mean ± SEM. * Significantly different from 30% CR group at the corresponding time point (P < 0.05, Mann-Whitney U test).

Similar articles

Cited by

References

    1. Patel AC, Nunez NP, Perkins SN, Barrett JC, Hursting SD. Effects of energy balance on cancer in genetically altered mice. J Nutr. 2004;134:3394S–3398S. - PubMed
    1. Calle EE, Kaaks R. Overweight, obesity and cancer: epidemiological evidence and proposed mechanisms. Nat Rev Cancer. 2004;4:579–591. - PubMed
    1. Park EJ, Lee JH, Yu GY, He G, Ali SR, Holzer RG, et al. Dietary and genetic obesity promote liver inflammation and tumorigenesis by enhancing IL-6 and TNF expression. Cell. 2010;140:197–208. - PMC - PubMed
    1. Yakar S, Nunez NP, Pennisi P, Brodt P, Sun H, Fallavollita L, et al. Increased Tumor Growth in Mice with Diet-Induced Obesity: Impact of Ovarian Hormones. Endocrinology. 2006 - PubMed
    1. Nunez NP, Perkins SN, Smith NC, Berrigan D, Berendes DM, Varticovski L, et al. Obesity accelerates mouse mammary tumor growth in the absence of ovarian hormones. Nutr Cancer. 2008;60:534–541. - PubMed

Publication types

MeSH terms