

Overexpression of endothelial nitric oxide synthase prevents diet-induced obesity and regulates adipocyte phenotype
- PMID: 22896587
- PMCID: PMC3707504
- DOI: 10.1161/CIRCRESAHA.112.266395
Overexpression of endothelial nitric oxide synthase prevents diet-induced obesity and regulates adipocyte phenotype
Abstract
Rationale: Endothelial dysfunction is a characteristic feature of diabetes and obesity in animal models and humans. Deficits in nitric oxide production by endothelial nitric oxide synthase (eNOS) are associated with insulin resistance, which is exacerbated by high-fat diet. Nevertheless, the metabolic effects of increasing eNOS levels have not been studied.
Objective: The current study was designed to test whether overexpression of eNOS would prevent diet-induced obesity and insulin resistance.
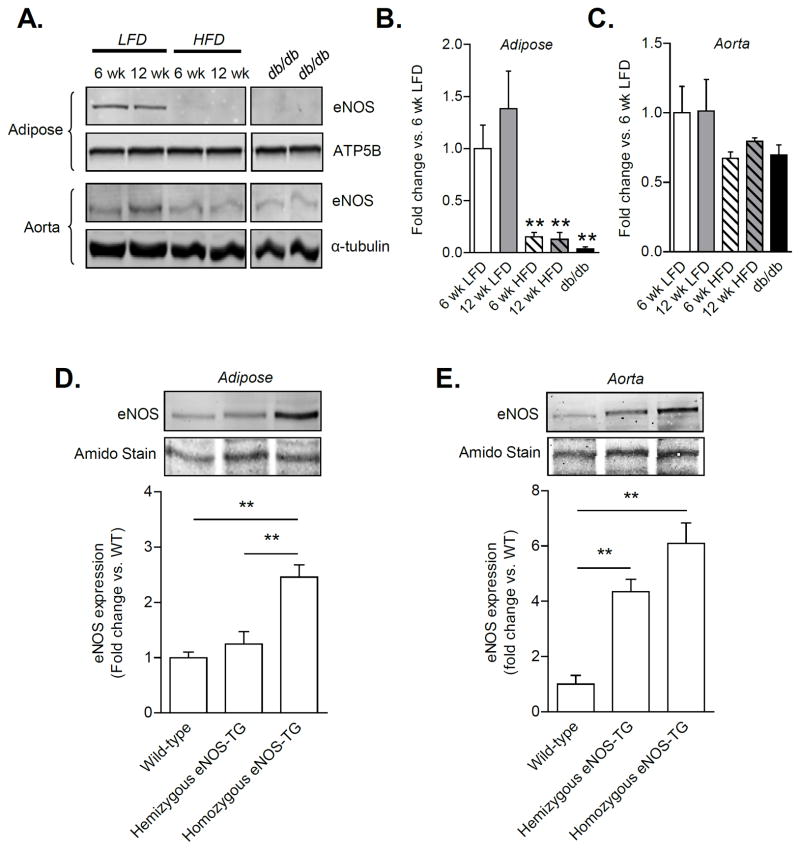
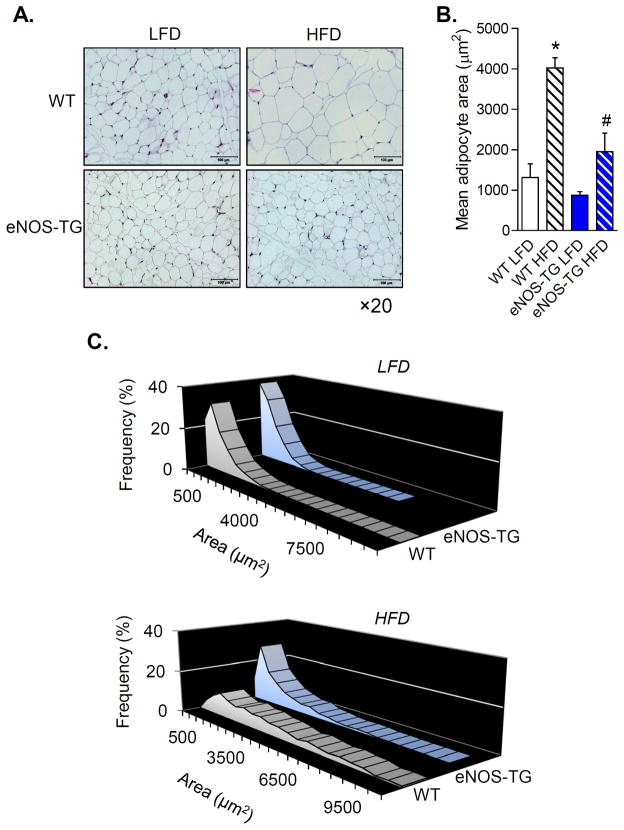
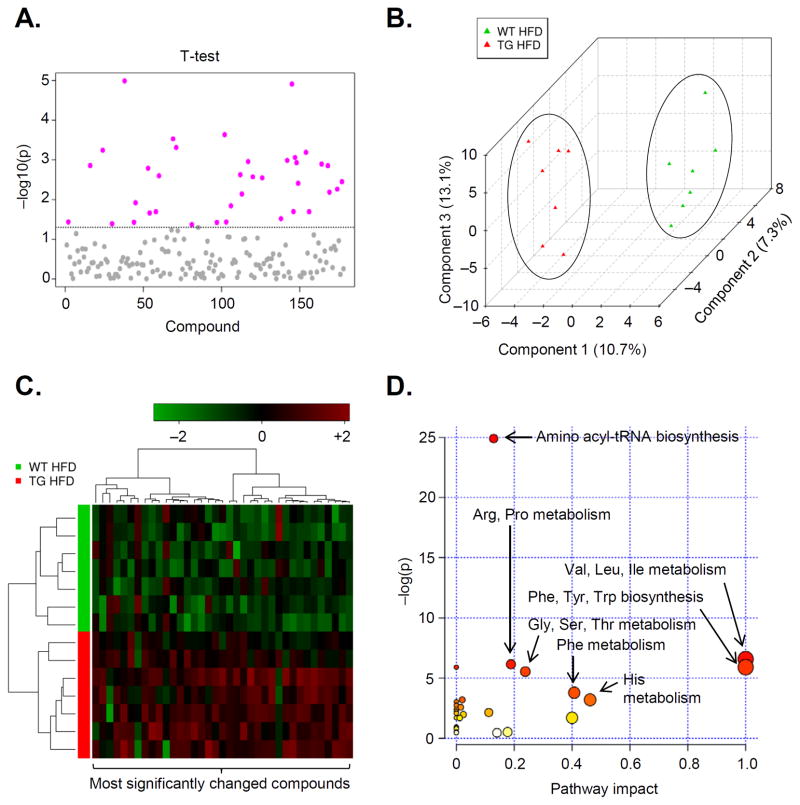
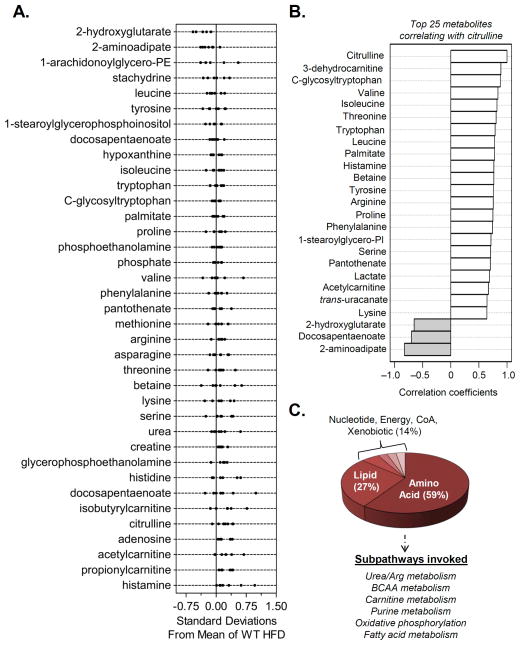
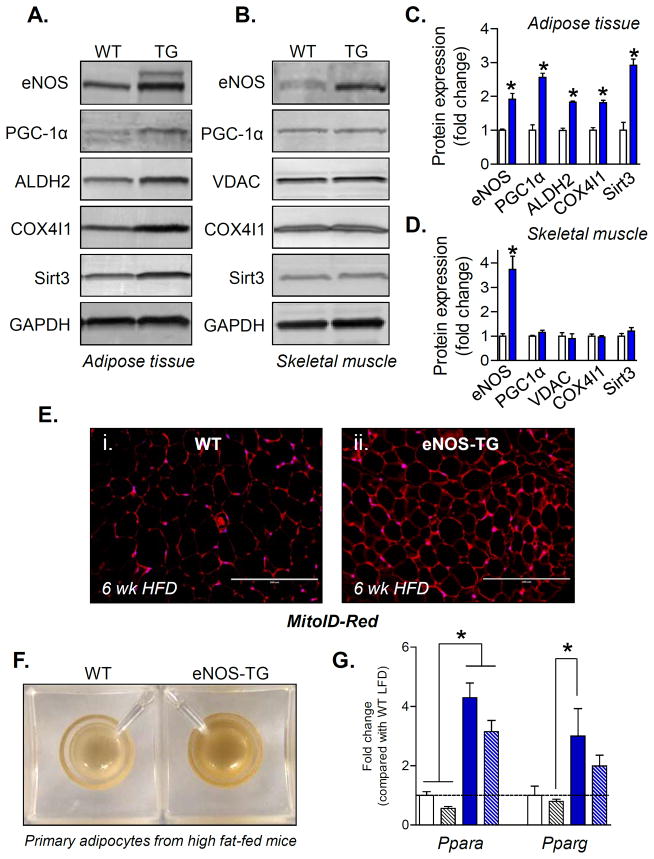
Methods and results: In db/db mice and in high-fat diet-fed wild-type C57BL/6J mice, the abundance of eNOS protein in adipose tissue was decreased without significant changes in eNOS levels in skeletal muscle or aorta. Mice overexpressing eNOS (eNOS transgenic mice) were resistant to diet-induced obesity and hyperinsulinemia, although systemic glucose intolerance remained largely unaffected. In comparison with wild-type mice, high-fat diet-fed eNOS transgenic mice displayed a higher metabolic rate and attenuated hypertrophy of white adipocytes. Overexpression of eNOS did not affect food consumption or diet-induced changes in plasma cholesterol or leptin levels, yet plasma triglycerides and fatty acids were decreased. Metabolomic analysis of adipose tissue indicated that eNOS overexpression primarily affected amino acid and lipid metabolism; subpathway analysis suggested changes in fatty acid oxidation. In agreement with these findings, adipose tissue from eNOS transgenic mice showed higher levels of PPAR-α and PPAR-γ gene expression, elevated abundance of mitochondrial proteins, and a higher rate of oxygen consumption.
Conclusions: These findings demonstrate that increased eNOS activity prevents the obesogenic effects of high-fat diet without affecting systemic insulin resistance, in part, by stimulating metabolic activity in adipose tissue.
Figures


Comment in
-
A new approach to weight loss: just activate endothelial NO synthase!Circ Res. 2012 Oct 12;111(9):1111-2. doi: 10.1161/CIRCRESAHA.112.279794. Circ Res. 2012. PMID: 23065339 Free PMC article. No abstract available.
Similar articles
-
Uncoupling of Endothelial Nitric Oxide Synthase in Perivascular Adipose Tissue of Diet-Induced Obese Mice.Arterioscler Thromb Vasc Biol. 2016 Jan;36(1):78-85. doi: 10.1161/ATVBAHA.115.306263. Epub 2015 Nov 19. Arterioscler Thromb Vasc Biol. 2016. PMID: 26586660
-
Ablation of eNOS does not promote adipose tissue inflammation.Am J Physiol Regul Integr Comp Physiol. 2016 Apr 15;310(8):R744-51. doi: 10.1152/ajpregu.00473.2015. Epub 2016 Feb 10. Am J Physiol Regul Integr Comp Physiol. 2016. PMID: 26864812 Free PMC article.
-
Adipocyte-specific expression of C-type natriuretic peptide suppresses lipid metabolism and adipocyte hypertrophy in adipose tissues in mice fed high-fat diet.Sci Rep. 2018 Feb 1;8(1):2093. doi: 10.1038/s41598-018-20469-z. Sci Rep. 2018. PMID: 29391544 Free PMC article.
-
Regulation of obesity and insulin resistance by nitric oxide.Free Radic Biol Med. 2014 Aug;73:383-99. doi: 10.1016/j.freeradbiomed.2014.05.016. Epub 2014 May 28. Free Radic Biol Med. 2014. PMID: 24878261 Free PMC article. Review.
-
Adipocyte dysfunctions linking obesity to insulin resistance and type 2 diabetes.Nat Rev Mol Cell Biol. 2008 May;9(5):367-77. doi: 10.1038/nrm2391. Nat Rev Mol Cell Biol. 2008. PMID: 18401346 Free PMC article. Review.
Cited by
-
Liver sinusoidal endothelial cells link hyperinsulinemia to hepatic insulin resistance.Diabetes. 2013 May;62(5):1478-89. doi: 10.2337/db12-1296. Epub 2013 Jan 24. Diabetes. 2013. PMID: 23349480 Free PMC article.
-
Endothelial Dysfunction in Obesity and Therapeutic Targets.Adv Exp Med Biol. 2024;1460:489-538. doi: 10.1007/978-3-031-63657-8_17. Adv Exp Med Biol. 2024. PMID: 39287863 Review.
-
Role of TRPM7 channels in hyperglycemia-mediated injury of vascular endothelial cells.PLoS One. 2013 Nov 1;8(11):e79540. doi: 10.1371/journal.pone.0079540. eCollection 2013. PLoS One. 2013. PMID: 24223965 Free PMC article.
-
Redox regulation of endothelial cell fate.Cell Mol Life Sci. 2014 Sep;71(17):3219-39. doi: 10.1007/s00018-014-1598-z. Epub 2014 Mar 15. Cell Mol Life Sci. 2014. PMID: 24633153 Free PMC article.
-
Resveratrol and endothelial nitric oxide.Molecules. 2014 Oct 9;19(10):16102-21. doi: 10.3390/molecules191016102. Molecules. 2014. PMID: 25302702 Free PMC article. Review.
References
-
- Ervin RB. Prevalence of metabolic syndrome among adults 20 years of age and over, by sex, age, race and ethnicity, and body mass index: United states, 2003–2006. Natl Health Stat Report. 2009:1–7. - PubMed
-
- Roger VL, Go AS, Lloyd-Jones DM, Benjamin EJ, Berry JD, Borden WB, Bravata DM, Dai S, Ford ES, Fox CS, Fullerton HJ, Gillespie C, Hailpern SM, Heit JA, Howard VJ, Kissela BM, Kittner SJ, Lackland DT, Lichtman JH, Lisabeth LD, Makuc DM, Marcus GM, Marelli A, Matchar DB, Moy CS, Mozaffarian D, Mussolino ME, Nichol G, Paynter NP, Soliman EZ, Sorlie PD, Sotoodehnia N, Turan TN, Virani SS, Wong ND, Woo D, Turner MB. Heart disease and stroke statistics--2012 update: A report from the american heart association. Circulation. 2011 - PMC - PubMed
-
- Williamson DF, Madans J, Anda RF, Kleinman JC, Kahn HS, Byers T. Recreational physical activity and ten-year weight change in a us national cohort. Int J Obes Relat Metab Disord. 1993;17:279–286. - PubMed
-
- Hu FB, Li TY, Colditz GA, Willett WC, Manson JE. Television watching and other sedentary behaviors in relation to risk of obesity and type 2 diabetes mellitus in women. JAMA. 2003;289:1785–1791. - PubMed
Publication types
MeSH terms
Substances
Grants and funding
LinkOut - more resources
Full Text Sources
Other Literature Sources
Medical
Molecular Biology Databases
Miscellaneous
