. 2012 Nov;86(21):11663-74.
doi: 10.1128/JVI.01147-12. Epub 2012 Aug 15.

Kaposi's sarcoma-associated herpesvirus microRNAs target IRAK1 and MYD88, two components of the toll-like receptor/interleukin-1R signaling cascade, to reduce inflammatory-cytokine expression

Affiliations

Kaposi's sarcoma-associated herpesvirus microRNAs target IRAK1 and MYD88, two components of the toll-like receptor/interleukin-1R signaling cascade, to reduce inflammatory-cytokine expression

Johanna R Abend et al. J Virol. 2012 Nov.

Abstract

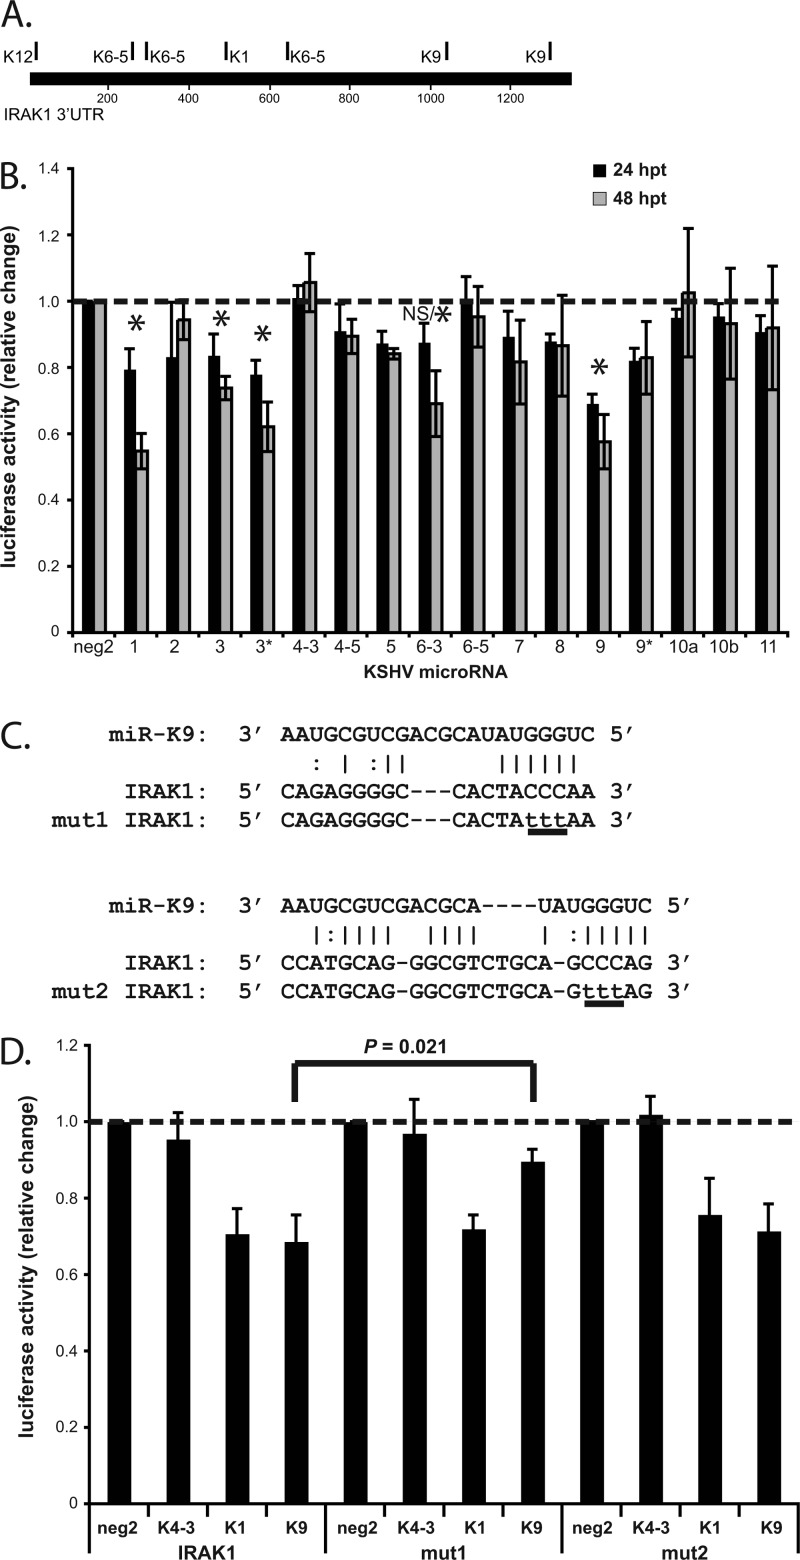
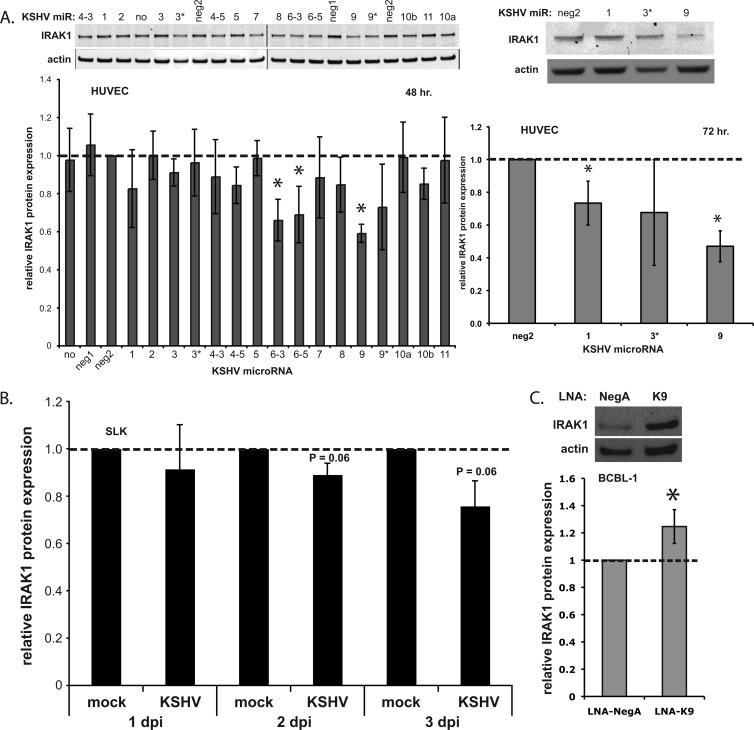
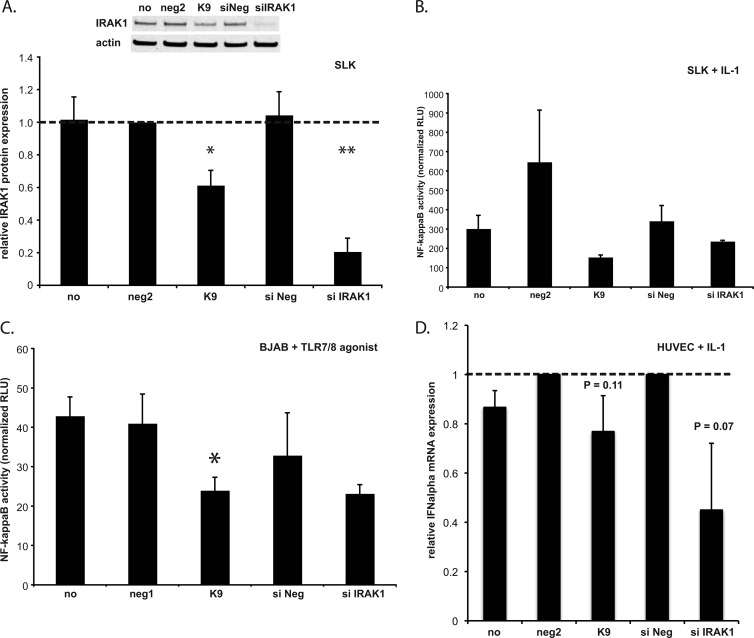
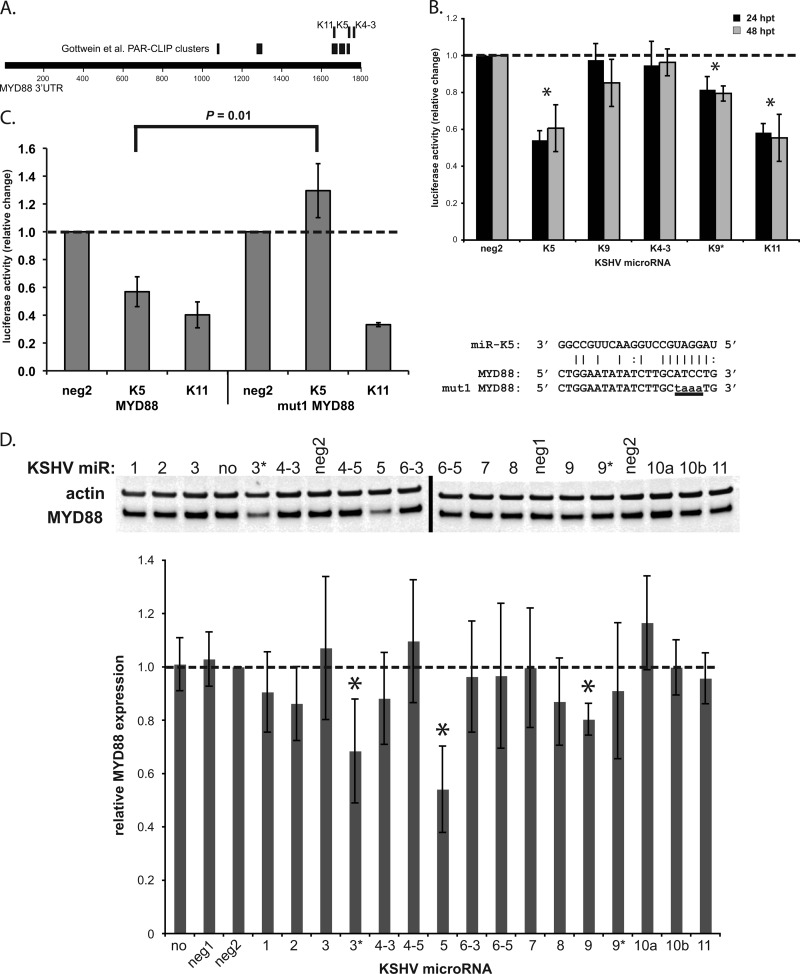
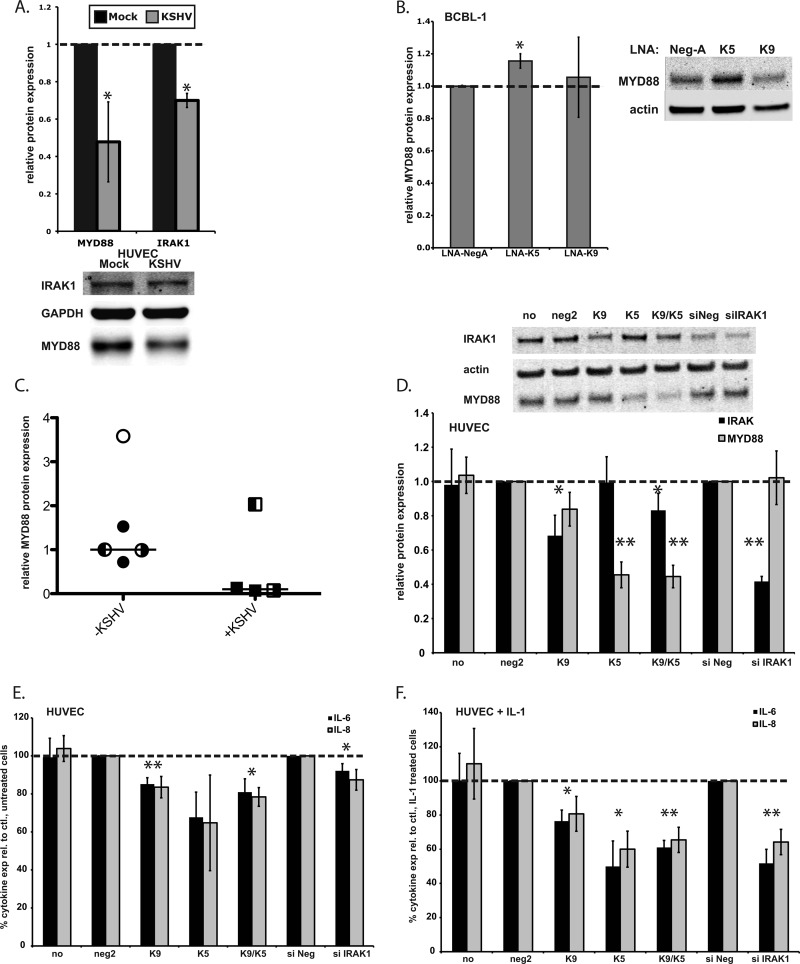
Kaposi's sarcoma (KS)-associated herpesvirus (KSHV) is the causative agent of KS, an important AIDS-associated malignancy. KSHV expresses at least 18 different mature microRNAs (miRNAs). We identified interleukin-1 receptor (IL-1R)-associated kinase 1 (IRAK1) as a potential target of miR-K12-9 (miR-K9) in an array data set examining changes in cellular gene expression levels in the presence of KSHV miRNAs. Using 3'-untranslated region (3'UTR) luciferase reporter assays, we confirmed that miR-K9 and other miRNAs inhibit IRAK1 expression. In addition, IRAK1 expression is downregulated in cells transfected with miR-K9 and during de novo KSHV infection. IRAK1 is an important component of the Toll-like receptor (TLR)/IL-1R signaling cascade. The downregulation of IRAK1 by miR-K9 resulted in the decreased stimulation of NF-κB activity in endothelial cells treated with IL-1α and in B cells treated with a TLR7/8 agonist. Interestingly, miR-K9 had a greater effect on NF-κB activity than did a small interfering RNA (siRNA) targeting IRAK1 despite the more efficient downregulation of IRAK1 expression with the siRNA. We hypothesized that KSHV miRNAs may also be regulating a second component of the TLR/IL-1R signaling cascade, resulting in a stronger phenotype. Reanalysis of the array data set identified myeloid differentiation primary response protein 88 (MYD88) as an additional potential target. 3'UTR luciferase reporter assays and Western blot analysis confirmed the targeting of MYD88 by miR-K5. The presence of miR-K9 and miR-K5 inhibited the production of IL-6 and IL-8 upon the IL-1α stimulation of endothelial cells. These results demonstrate KSHV-encoded miRNAs regulating the TLR/IL-1R signaling cascade at two distinct points and suggest the importance of these pathways during viral infection.


Figures

Fig 1
Fig 1
miR-K9 targets the 3′UTR of IRAK1. (A) Map of the IRAK1 3′UTR with TargetScan-predicted hits for KSHV miRNAs. (B) 293 cells were transfected with each of the KSHV miRNAs and the reporter plasmid expressing Renilla luciferase fused to the 3′UTR of IRAK1. Lysates were analyzed by luciferase assays at 24 and 48 h posttransfection (hpt), and results are presented as the change in normalized relative light units relative to negative-control miRNA (neg2). Averages and standard deviations were calculated from three independent experiments. NS/* indicates that the change in activity was not significant at 24 hpt but was significant at 48 hpt. (C) The sequence of miR-K9 and its putative binding sites within the 3′UTR of IRAK1 are shown, based on predictions from miRanda and TargetScan. The same 3-bp mutation (underlined lowercase letters) was made at two different sites in the reporter plasmid containing the 3′UTR of IRAK1 (mut1 and mut2), to disrupt the binding of miR-K9. (D) Luciferase assays were performed at 24 hpt as described above for panel B, using only neg2, miR-K4-3, miR-K1, and miR-K9 and the reporter plasmid containing the wild-type 3′UTR (IRAK1) or the 3′UTR mutated as shown in panel C (mut1 and mut2). Averages and standard deviations were calculated from three independent experiments.
Fig 2
Fig 2
miR-K9 downregulates the expression of IRAK1. (A) HUVECs were transfected with each of the KSHV miRNAs. Total cell lysates were harvested at 48 h (left) or 72 h (right) after transfection and analyzed by Western blotting. The top panels show representative images of IRAK1 and actin expression; the bottom panels show the average change in IRAK1/actin ratios relative to levels in negative-control miRNA-transfected cells (neg2). Averages and standard deviations were calculated from four independent experiments. “no” denotes no miRNA; “neg1” and “neg2” denote two different negative-control miRNAs. (B) SLK cells were infected with KSHV, and total cell lysates were harvested at 1, 2, and 3 dpi for analysis by Western blotting. Results are presented as the average changes in normalized IRAK1 expression levels relative to levels in mock-infected cells. (C) BCBL-1 cells were transfected with control LNAs (LNA-NegA) or LNAs targeting miR-K9 (LNA-K9) and analyzed by Western blotting. Results are presented as the average changes in normalized IRAK1 expression levels relative to levels in the control. Averages and standard deviations were calculated from three independent experiments. The dashed line indicates IRAK1 expression in the neg2 control.
Fig 3
Fig 3
miR-K9-mediated downregulation of IRAK1 inhibits IL-1α- and TLR agonist-induced NF-κB activation and IFN-α expression. (A) SLK cells were transfected with either miR-K9 or siRNAs targeting IRAK1, and total cell lysates were harvested at 72 hpt and analyzed by Western blotting. Results are presented as the average changes in normalized IRAK1 expression levels relative to levels in neg2-transfected SLK cells. Averages and standard deviations were calculated from three independent experiments. “no” denotes no miRNA; “neg2” denotes a negative-control miRNA; “siNeg” denotes a negative-control siRNA. (B) SLK cells were cotransfected with the NF-κB luciferase reporter plasmid and the indicated small RNA, treated with IL-1α for 8 h, and assayed for luciferase activity as a measurement of NF-κB activity at 72 hpt. Results are presented as the relative level of NF-κB activity in IL-1α-treated cells (in relative light units [RLU] normalized to the internal control). Averages and standard deviations were calculated from three independent experiments. (C) BJAB cells were transfected as described in Materials and Methods, treated with a TLR7/8 agonist for 24 h, and assayed for luciferase activity as a measurement of NF-κB activation. Results are presented as the relative activity in agonist-treated cells (in relative light units normalized to the internal control). Averages and standard deviations were calculated from three independent experiments. “neg1” denotes an additional negative-control miRNA (similar to neg2). (D) HUVECs were transfected with miR-K9 and treated with IL-1α as described in the legend of Fig. 5. RNA was harvested, and RT-qPCR was performed to measure transcript levels. Results show expression changes relative to negative-control miRNA (neg2) or control siRNA (siNeg) levels. Averages and standard deviations were calculated from three independent experiments.
Fig 4
Fig 4
MYD88, a second component of the TLR/IL-1R signaling cascade, is targeted by KSHV miRNAs. (A) Map of the MYD88 3′UTR with TargetScan-predicted hits for KSHV miRNAs (top) and PAR-CLIP clusters (miRNA/argonaute-associated sequences) described previously (14) (middle). (B) 293 cells were transfected with the indicated KSHV miRNAs and the reporter plasmid expressing Renilla luciferase fused to the 3′UTR of MYD88. Lysates were analyzed by a luciferase assay at 24 and 48 h posttransfection (hpt), and results are presented as the changes in normalized relative light units relative to the negative-control miRNA (neg2). Averages and standard deviations were calculated from three independent experiments. (C) Luciferase assays were performed at 24 hpt as in panel B with the reporter plasmid containing the wild-type 3′UTR (MYD88) or the mutated 3′UTR (mut1, as shown). Averages and standard deviations were calculated from three independent experiments. (D) HUVECs were transfected with each of the KSHV miRNAs. Total cell lysates were harvested at 48 hpt and analyzed by Western blotting. Top panels show representative images of MYD88 and actin expression levels; the bottom panel shows the average change in the normalized MYD88/actin expression level relative to levels in negative-control miRNA-transfected cells (neg2). Averages and standard deviations were calculated from four independent experiments. The dashed line indicates MYD88 expression in the neg2 control. “no” denotes no miRNA; “neg1” and “neg2” denote two different negative-control miRNAs.
Fig 5
Fig 5
KSHV infection represses MYD88 and IRAK1 expressions. miR-K9 and miR-K5 dampen the production of proinflammatory cytokines in response to IL-1α stimulation. (A) HUVECs were infected with KSHV and harvested after 7 days. The relative changes in IRAK1 and MYD88 protein expression levels normalized to GAPDH levels are shown compared to mock-infected cells from three independent experiments. The bottom panel shows a representative Western blot. (B) KSHV-infected BCBL-1 cells were transfected with control LNA miRNA inhibitors (LNA-NegA) or inhibitors of miR-K5 or miR-K9. The relative change in the protein expression level normalized to the actin level was calculated from four independent experiments. (C) Relative levels of the MYD88 protein normalized to GAPDH levels were calculated for KSHV-negative samples (open circle, HUVECs; filled circles, follicular hyperplasia of lymph node; left-filled circle, normal lymph node; right-filled circle, normal skin) or KSHV-positive samples (filled squares, PEL/KS of lymph node; left-filled square, KS of lymph node; right-filled square, KS of skin). Horizontal lines indicate median values. (D) HUVECs were transfected with miR-K9, miR-K5, or siRNA targeting IRAK1, and total cell lysates were harvested at 28 hpt and analyzed by Western blotting. Shown are the average changes in normalized IRAK1 or MYD88 expression levels relative to levels in neg2-transfected cells. Averages and standard deviations were calculated from at least three independent experiments. “no” denotes no miRNA; “neg2” denotes a negative-control miRNA. (E and F) HUVECs were transfected for 24 h, as described above for panel D. Cells were treated with IL-1α for 4 h, and culture supernatants were harvested 28 h after transfection and analyzed for IL-6 and IL-8 expression levels in unstimulated (E) or IL-1α-stimulated (F) cells. Results are presented as percent cytokine expression relative to the appropriate negative control. Averages and standard deviations were calculated from at least three independent experiments.

Similar articles

Cited by

References

    1. Abend JR, Uldrick T, Ziegelbauer JM. 2010. Regulation of tumor necrosis factor-like weak inducer of apoptosis receptor protein (TWEAKR) expression by Kaposi's sarcoma-associated herpesvirus microRNA prevents TWEAK-induced apoptosis and inflammatory cytokine expression. J. Virol. 84:12139–12151 - PMC - PubMed
    1. Adachi O, et al. 1998. Targeted disruption of the MyD88 gene results in loss of IL-1- and IL-18-mediated function. Immunity 9:143–150 - PubMed
    1. Akira S, Takeda K. 2004. Toll-like receptor signalling. Nat. Rev. Immunol. 4:499–511 - PubMed
    1. Bellare P, Ganem D. 2009. Regulation of KSHV lytic switch protein expression by a virus-encoded microRNA: an evolutionary adaptation that fine-tunes lytic reactivation. Cell Host Microbe 6:570–575 - PMC - PubMed
    1. Bhaumik D, et al. 2009. MicroRNAs miR-146a/b negatively modulate the senescence-associated inflammatory mediators IL-6 and IL-8. Aging (Albany NY) 1:402–411 - PMC - PubMed

Publication types

MeSH terms