

Cyclin-dependent kinase inhibitor Cdkn2c deficiency promotes B1a cell expansion and autoimmunity in a mouse model of lupus
- PMID: 22896639
- PMCID: PMC3436953
- DOI: 10.4049/jimmunol.1200556
Cyclin-dependent kinase inhibitor Cdkn2c deficiency promotes B1a cell expansion and autoimmunity in a mouse model of lupus
Abstract
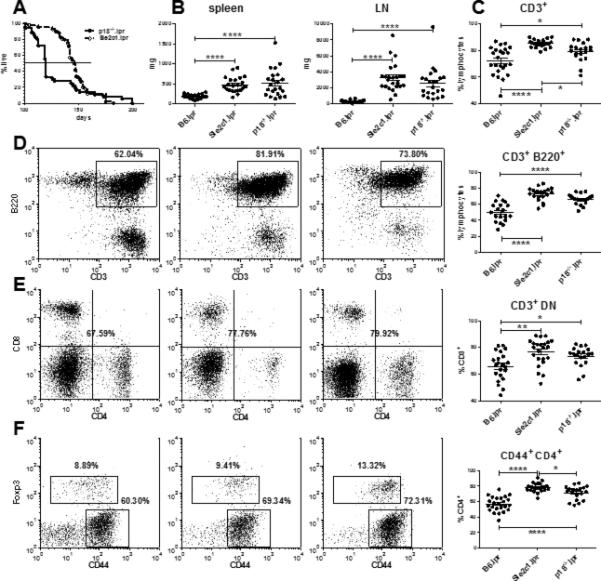
The lupus-prone NZM2410 mice present an expanded B1a cell population that we have mapped to the Sle2c1 lupus susceptibility locus. The expression of Cdkn2c, a gene encoding for cyclin-dependent kinase inhibitor p18(Ink4c) and located within Sle2c1, is significantly lower in B6.Sle2c1 B cells than in B6 B cells. To test the hypothesis that the B1a cell expansion in B6.Sle2c1 mice was due to a defective p18 expression, we analyzed the B1a cell phenotypes of p18-deficient C57BL/6 mice. We found a dose-dependent negative correlation between the number of B1a cells and p18 expression in B cells, with p18-deficient mice showing an early expansion of the peritoneal B1a cell pool. p18 deficiency enhanced the homeostatic expansion of B1a cells but not of splenic conventional B cells, and the elevated number of B6.Sle2c1 B1a cells was normalized by cyclin D2 deficiency. These data demonstrated that p18 is a key regulator of the size of the B1a cell pool. B6.p18(-/-) mice produced significant amounts of anti-DNA IgM and IgG, indicating that p18 deficiency contributes to humoral autoimmunity. Finally, we have shown that Sle2c1 increases lpr-associated lymphadenopathy and T cell-mediated pathology. B6.p18(-/-).lpr mice showed a greater lymphadenopathy than B6.Sle2c1.lpr mice, but their renal pathology was intermediate between that of B6.lpr and B6.Sle2c1.lpr mice. This indicated that p18-deficiency synergizes, at least partially, with lpr-mediated pathology. These results show that Cdkn2c contributes to lupus susceptibility by regulating the size of the B1a cell compartment and hence their contribution to autoimmunity.
Figures


Similar articles
-
Cyclin-dependent kinase inhibitor Cdkn2c regulates B cell homeostasis and function in the NZM2410-derived murine lupus susceptibility locus Sle2c1.J Immunol. 2011 Jun 15;186(12):6673-82. doi: 10.4049/jimmunol.1002544. Epub 2011 May 4. J Immunol. 2011. PMID: 21543644 Free PMC article.
-
The combination of two Sle2 lupus-susceptibility loci and Cdkn2c deficiency leads to T-cell-mediated pathology in B6.Fas(lpr) mice.Genes Immun. 2013 Sep;14(6):373-9. doi: 10.1038/gene.2013.28. Epub 2013 May 23. Genes Immun. 2013. PMID: 23698709 Free PMC article.
-
Genetic variation at a Yin-Yang 1 response site regulates the transcription of cyclin-dependent kinase inhibitor p18INK4C transcript in lupus-prone mice.J Immunol. 2012 May 15;188(10):4992-5002. doi: 10.4049/jimmunol.1101992. Epub 2012 Apr 13. J Immunol. 2012. PMID: 22504641 Free PMC article.
-
Contribution of B-1a cells to systemic lupus erythematosus in the NZM2410 mouse model.Ann N Y Acad Sci. 2015 Dec;1362(1):215-23. doi: 10.1111/nyas.12607. Epub 2015 Feb 26. Ann N Y Acad Sci. 2015. PMID: 25728381 Free PMC article. Review.
-
The central and multiple roles of B cells in lupus pathogenesis.Immunol Rev. 1999 Jun;169:107-21. doi: 10.1111/j.1600-065x.1999.tb01310.x. Immunol Rev. 1999. PMID: 10450512 Review.
Cited by
-
Genetic and cellular dissection of the activation of AM14 rheumatoid factor B cells in a mouse model of lupus.J Leukoc Biol. 2015 Aug;98(2):209-21. doi: 10.1189/jlb.1A1214-576R. Epub 2015 May 8. J Leukoc Biol. 2015. PMID: 25957308 Free PMC article.
-
IL-10 Production Is Critical for Sustaining the Expansion of CD5+ B and NKT Cells and Restraining Autoantibody Production in Congenic Lupus-Prone Mice.PLoS One. 2016 Mar 10;11(3):e0150515. doi: 10.1371/journal.pone.0150515. eCollection 2016. PLoS One. 2016. PMID: 26964093 Free PMC article.
-
The granulocyte colony stimulating factor pathway regulates autoantibody production in a murine induced model of systemic lupus erythematosus.Arthritis Res Ther. 2013 Apr 8;15(2):R49. doi: 10.1186/ar4208. Arthritis Res Ther. 2013. PMID: 23566364 Free PMC article.
-
Urinary Long Non-Coding RNA Levels as Biomarkers of Lupus Nephritis.Int J Mol Sci. 2023 Jul 22;24(14):11813. doi: 10.3390/ijms241411813. Int J Mol Sci. 2023. PMID: 37511572 Free PMC article.
-
A Variant of the Histone-Binding Protein sNASP Contributes to Mouse Lupus.Front Immunol. 2019 Apr 2;10:637. doi: 10.3389/fimmu.2019.00637. eCollection 2019. Front Immunol. 2019. PMID: 31001259 Free PMC article.
References
-
- Berland R, Wortis HH. Origins and functions of B-1 cells with notes on the role of CD5. Ann. Rev. Immunol. 2002;20:253–300. - PubMed
-
- Piatelli MJ, Tanguay D, Rothstein TL, Chiles TC. Cell cycle control mechanisms in B-1 and B-2 lymphoid subsets. Immunol. Res. 2003;27:31–51. - PubMed
-
- Solvason N, Wu WW, Parry D, Mahony D, Lam EW, Glassford J, Klaus GG, Sicinski P, Weinberg R, Liu YJ, Howard M, Lees E. Cyclin D2 is essential for BCR-mediated proliferation and CD5 B cell development. Intern. Immunol. 2000;12:631–638. - PubMed
-
- Mataraza JM, Tumang JR, Gumina MR, Gurdak SM, Rothstein TL, Chiles TC. Disruption of cyclin D3 blocks proliferation of normal B-1a cells, but loss of cyclin D3 is compensated by cyclin D2 in cyclin D3-deficient mice. J. Immunol. 2006;177:787–795. - PubMed
Publication types
MeSH terms
Substances
Grants and funding
LinkOut - more resources
Full Text Sources
Medical
Molecular Biology Databases
