

Predation risk, stoichiometric plasticity and ecosystem elemental cycling
- PMID: 22896643
- PMCID: PMC3441073
- DOI: 10.1098/rspb.2012.1315
Predation risk, stoichiometric plasticity and ecosystem elemental cycling
Abstract
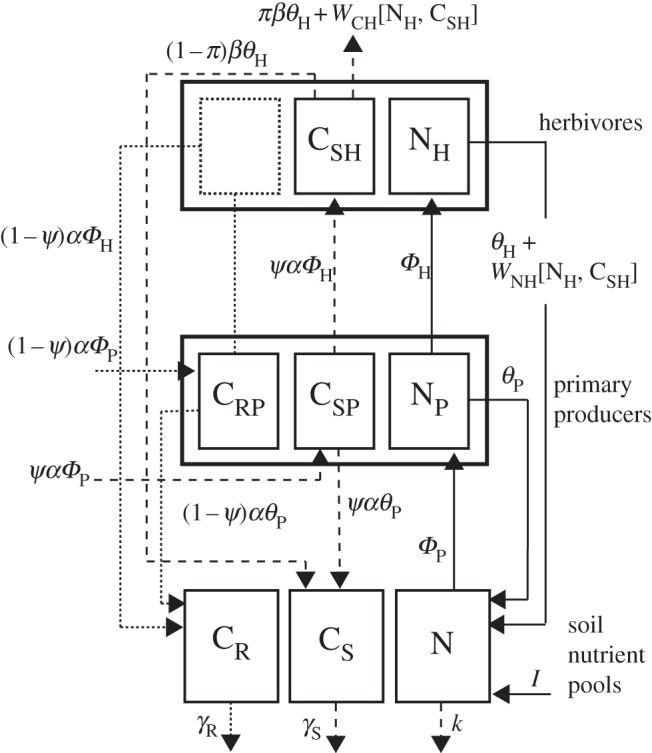
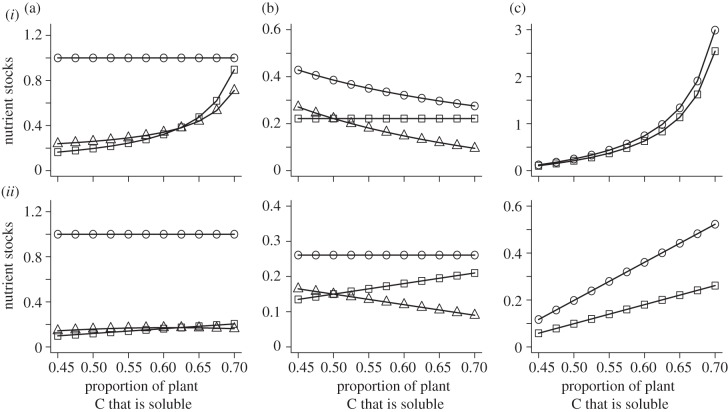
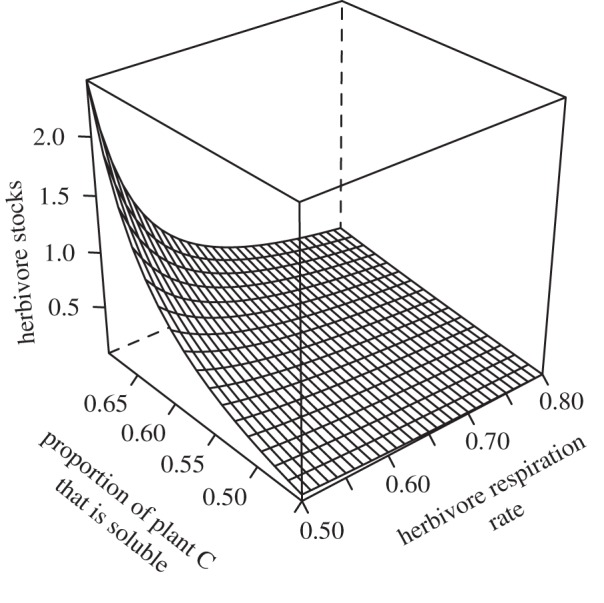
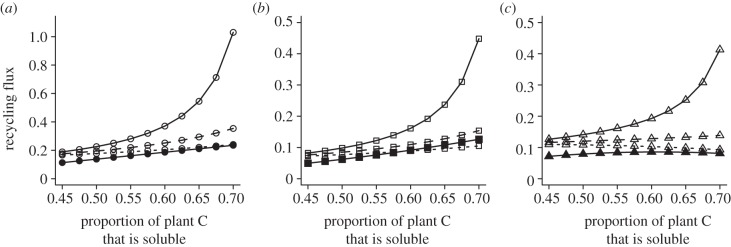
It is widely held that herbivore growth and production is limited by dietary nitrogen (N) that in turn constrains ecosystem elemental cycling. Yet, emerging evidence suggests that this conception of limitation may be incomplete, because chronic predation risk heightens herbivore metabolic rate and shifts demand from N-rich proteins to soluble carbohydrate-carbon (C). Because soluble C can be limiting, predation risk may cause ecosystem elemental cycling rates and stoichiometric balance to depend on herbivore physiological plasticity. We report on a stoichiometrically explicit ecosystem model that investigates this problem. The model tracks N, and soluble and recalcitrant C through ecosystem compartments. We evaluate how soluble plant C influences C and N stocks and flows in the presence and absence of predation risk. Without risk, herbivores are limited by N and respire excess C so that plant-soluble C has small effects only on elemental stocks and flows. With predation risk, herbivores are limited by soluble C and release excess N, so plant-soluble C critically influences ecosystem elemental stocks flows. Our results emphasize that expressing ecosystem stoichiometric balance using customary C:N ratios that do not distinguish between soluble and recalcitrant C may not adequately describe limitations on elemental cycling.
Figures
Similar articles
-
Linking predation risk, herbivore physiological stress and microbial decomposition of plant litter.J Vis Exp. 2013 Mar 12;(73):e50061. doi: 10.3791/50061. J Vis Exp. 2013. PMID: 23524884 Free PMC article.
-
Herbivore physiological response to predation risk and implications for ecosystem nutrient dynamics.Proc Natl Acad Sci U S A. 2010 Aug 31;107(35):15503-7. doi: 10.1073/pnas.1009300107. Epub 2010 Aug 16. Proc Natl Acad Sci U S A. 2010. PMID: 20713698 Free PMC article.
-
Fear of predation slows plant-litter decomposition.Science. 2012 Jun 15;336(6087):1434-8. doi: 10.1126/science.1220097. Science. 2012. PMID: 22700928
-
Carbon storage in terrestrial ecosystems: do browsing and grazing herbivores matter?Biol Rev Camb Philos Soc. 2012 Feb;87(1):72-94. doi: 10.1111/j.1469-185X.2011.00185.x. Epub 2011 Jun 2. Biol Rev Camb Philos Soc. 2012. PMID: 21635684 Review.
-
Does plant trait diversity reduce the ability of herbivores to defend against predators? The plant variability-gut acclimation hypothesis.Curr Opin Insect Sci. 2016 Apr;14:25-31. doi: 10.1016/j.cois.2016.01.001. Epub 2016 Jan 23. Curr Opin Insect Sci. 2016. PMID: 27436643 Review.
Cited by
-
Caught in the web: Spider web architecture affects prey specialization and spider-prey stoichiometric relationships.Ecol Evol. 2018 May 30;8(13):6449-6462. doi: 10.1002/ece3.4028. eCollection 2018 Jul. Ecol Evol. 2018. PMID: 30038747 Free PMC article.
-
Metabolic stoichiometry and the ecology of fear in Trinidadian guppies: consequences for life histories and stream ecosystems.Oecologia. 2014 Nov;176(3):691-701. doi: 10.1007/s00442-014-3084-6. Epub 2014 Sep 26. Oecologia. 2014. PMID: 25255854
-
Competitive displacement alters top-down effects on carbon dioxide concentrations in a freshwater ecosystem.Oecologia. 2014 May;175(1):353-61. doi: 10.1007/s00442-013-2877-3. Epub 2014 Jan 8. Oecologia. 2014. PMID: 24399484
-
Interactive effects of predation risk and conspecific density on the nutrient stoichiometry of prey.Ecol Evol. 2015 Oct 6;5(21):4747-56. doi: 10.1002/ece3.1740. eCollection 2015 Nov. Ecol Evol. 2015. PMID: 26640656 Free PMC article.
-
Diet and predation risk affect tissue and excretion nutrients of Trinidadian guppies: a field survey.Sci Rep. 2024 Dec 30;14(1):31923. doi: 10.1038/s41598-024-83420-5. Sci Rep. 2024. PMID: 39738379 Free PMC article.
References
-
- DeAngelis D. L. 1992. Dynamics of nutrient cycling and food webs. Population and community biology series. London, UK: Chapman and Hall
-
- Loreau M. 1995. Consumers as maximizers of matter and energy flow in ecosystems. Am. Nat. 145, 22–42
-
- DeAngelis D. L., Bartell S. M., Brenkert A. L. 1989. Effects of nutrient recycling and food chain length on resilience. Am. Nat. 134, 778–80510.1086/285011 (doi:10.1086/285011) - DOI - DOI
-
- Elser J. J., et al. 2000. Nutritional constraints in terrestrial and freshwater food webs. Nature 408, 578–58010.1038/35046058 (doi:10.1038/35046058) - DOI - DOI - PubMed
-
- Sterner R. W., Elser J. J. 2002. Ecological stoichiometry. Princeton, NJ: Princeton University Press
Publication types
MeSH terms
Substances
LinkOut - more resources
Full Text Sources
