

Neural control of tuneable skin iridescence in squid
- PMID: 22896651
- PMCID: PMC3441077
- DOI: 10.1098/rspb.2012.1374
Neural control of tuneable skin iridescence in squid
Abstract
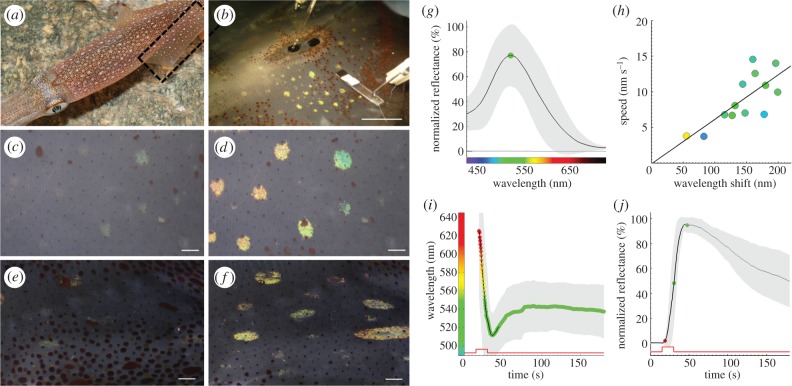
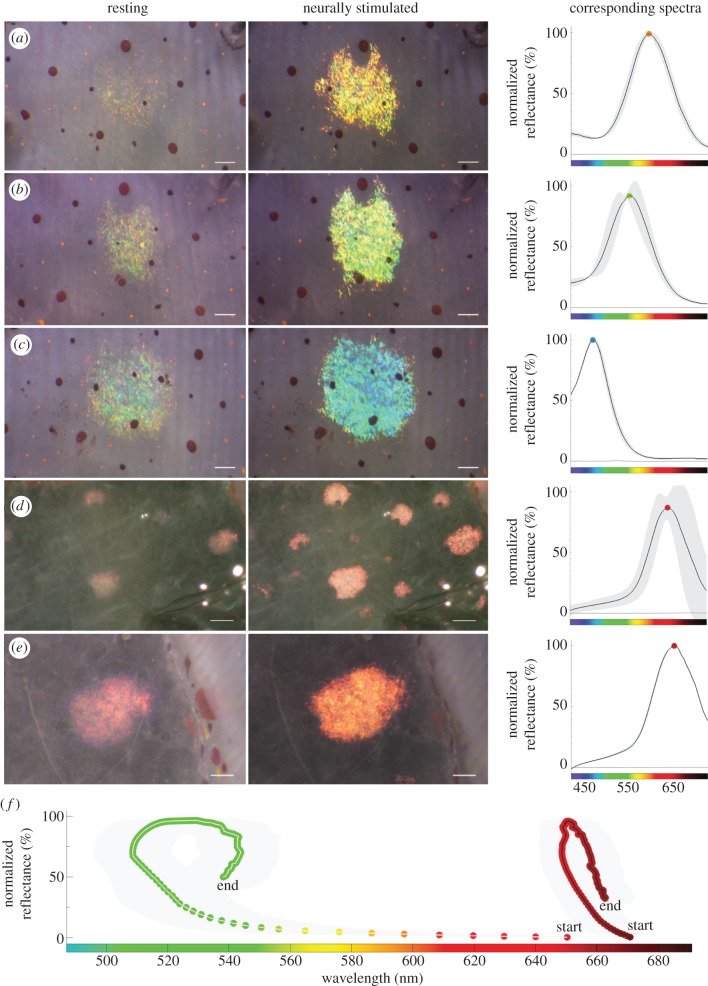
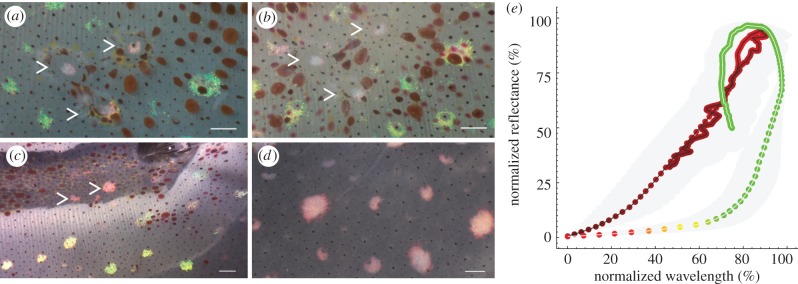
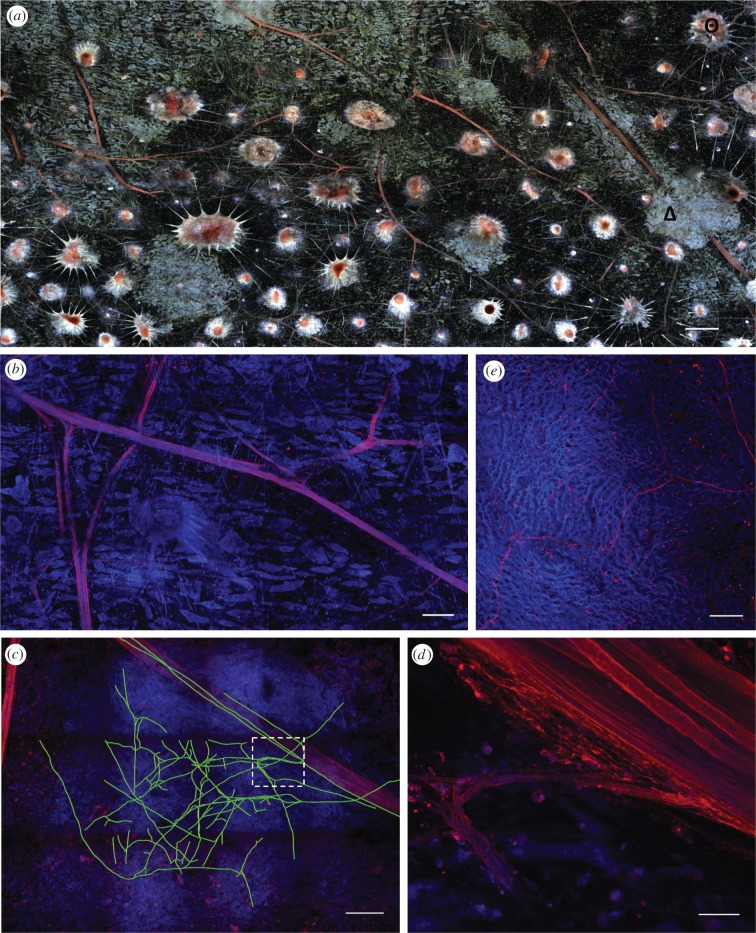
Fast dynamic control of skin coloration is rare in the animal kingdom, whether it be pigmentary or structural. Iridescent structural coloration results when nanoscale structures disrupt incident light and selectively reflect specific colours. Unlike animals with fixed iridescent coloration (e.g. butterflies), squid iridophores (i.e. aggregations of iridescent cells in the skin) produce dynamically tuneable structural coloration, as exogenous application of acetylcholine (ACh) changes the colour and brightness output. Previous efforts to stimulate iridophores neurally or to identify the source of endogenous ACh were unsuccessful, leaving researchers to question the activation mechanism. We developed a novel neurophysiological preparation in the squid Doryteuthis pealeii and demonstrated that electrical stimulation of neurons in the skin shifts the spectral peak of the reflected light to shorter wavelengths (greater than 145 nm) and increases the peak reflectance (greater than 245%) of innervated iridophores. We show ACh is released within the iridophore layer and that extensive nerve branching is seen within the iridophore. The dynamic colour shift is significantly faster (17 s) than the peak reflectance increase (32 s), revealing two distinct mechanisms. Responses from a structurally altered preparation indicate that the reflectin protein condensation mechanism explains peak reflectance change, while an undiscovered mechanism causes the fast colour shift.
Figures
Similar articles
-
Expression of squid iridescence depends on environmental luminance and peripheral ganglion control.J Exp Biol. 2014 Mar 15;217(Pt 6):850-8. doi: 10.1242/jeb.091884. J Exp Biol. 2014. PMID: 24622892
-
Physiological color change in squid iridophores. II. Ultrastructural mechanisms in Lolliguncula brevis.Cell Tissue Res. 1990 Jan;259(1):15-24. doi: 10.1007/BF00571425. Cell Tissue Res. 1990. PMID: 2297782
-
Physiological color change in squid iridophores. I. Behavior, morphology and pharmacology in Lolliguncula brevis.Cell Tissue Res. 1990 Jan;259(1):3-14. doi: 10.1007/BF00571424. Cell Tissue Res. 1990. PMID: 2297784
-
Mechanisms and behavioural functions of structural coloration in cephalopods.J R Soc Interface. 2009 Apr 6;6 Suppl 2(Suppl 2):S149-63. doi: 10.1098/rsif.2008.0366.focus. Epub 2008 Dec 15. J R Soc Interface. 2009. PMID: 19091688 Free PMC article. Review.
-
Iridescence: a functional perspective.J R Soc Interface. 2009 Apr 6;6 Suppl 2(Suppl 2):S115-32. doi: 10.1098/rsif.2008.0395.focus. J R Soc Interface. 2009. PMID: 19336344 Free PMC article. Review.
Cited by
-
Molecular characterization of cell types in the squid Loligo vulgaris.Elife. 2023 Jan 3;12:e80670. doi: 10.7554/eLife.80670. Elife. 2023. PMID: 36594460 Free PMC article.
-
Recent advances in bioelectronics chemistry.Chem Soc Rev. 2020 Nov 21;49(22):7978-8035. doi: 10.1039/d0cs00333f. Epub 2020 Jul 16. Chem Soc Rev. 2020. PMID: 32672777 Free PMC article. Review.
-
At the Intersection of Natural Structural Coloration and Bioengineering.Biomimetics (Basel). 2022 May 23;7(2):66. doi: 10.3390/biomimetics7020066. Biomimetics (Basel). 2022. PMID: 35645193 Free PMC article. Review.
-
An Unexpected Diversity of Photoreceptor Classes in the Longfin Squid, Doryteuthis pealeii.PLoS One. 2015 Sep 9;10(9):e0135381. doi: 10.1371/journal.pone.0135381. eCollection 2015. PLoS One. 2015. PMID: 26351853 Free PMC article.
-
Light organ photosensitivity in deep-sea shrimp may suggest a novel role in counterillumination.Sci Rep. 2020 Mar 11;10(1):4485. doi: 10.1038/s41598-020-61284-9. Sci Rep. 2020. PMID: 32161283 Free PMC article.
References
-
- Fox H. M., Vevers G. 1960. The nature of animal colours New York, NY: Macmillan
-
- Fox D. L. 1976. Animal biochromes and structural colours: physical, chemical, distributional and physiological features of coloured bodies in the animal world, 2nd edn Berkeley, CA: University of California Press
-
- Land M. F. 1972. The physics and biology of animal reflectors. Prog. Biophys. Mol. Biol. 24, 75–10610.1016/0079-6107(72)90004-1 (doi:10.1016/0079-6107(72)90004-1) - DOI - DOI - PubMed
-
- Denton E. J., Land M. F. 1971. Mechanism of reflexion in silvery layers of fish and cephalopods. Proc. R. Soc. Lond. B 178, 43–6110.1098/rspb.1971.0051 (doi:10.1098/rspb.1971.0051) - DOI - DOI - PubMed
-
- Kinoshita S., Yoshioka S., Miyazaki J. 2008. Physics of structural colors. Rep. Prog. Phys. 71, 1–3010.1088/0034-4885/71/7/076401 (doi:10.1088/0034-4885/71/7/076401) - DOI - DOI
Publication types
MeSH terms
Substances
LinkOut - more resources
Full Text Sources
Other Literature Sources
