

Src Inhibition with saracatinib reverses fulvestrant resistance in ER-positive ovarian cancer models in vitro and in vivo
- PMID: 22896656
- PMCID: PMC3698880
- DOI: 10.1158/1078-0432.CCR-12-1257
Src Inhibition with saracatinib reverses fulvestrant resistance in ER-positive ovarian cancer models in vitro and in vivo
Abstract
Purpose: More effective, less toxic treatments for recurrent ovarian cancer are needed. Although more than 60% of ovarian cancers express the estrogen receptor (ER), ER-targeted drugs have been disappointing due to drug resistance. In other estrogen-sensitive cancers, estrogen activates Src to phosphorylate p27 promoting its degradation and increasing cell-cycle progression. Because Src is activated in most ovarian cancers, we investigated whether combined Src and ER blockade by saracatinib and fulvestrant would circumvent antiestrogen resistance.
Experimental design: ER and Src were assayed in 338 primary ovarian cancers. Dual ER and Src blockade effects on cell cycle, ER target gene expression, and survival were assayed in ERα+ ovarian cancer lines, a primary human ovarian cancer culture in vitro, and on xenograft growth.
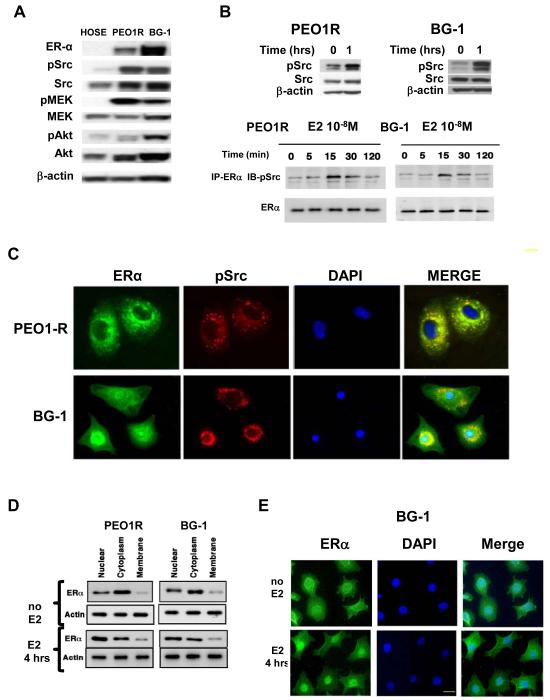
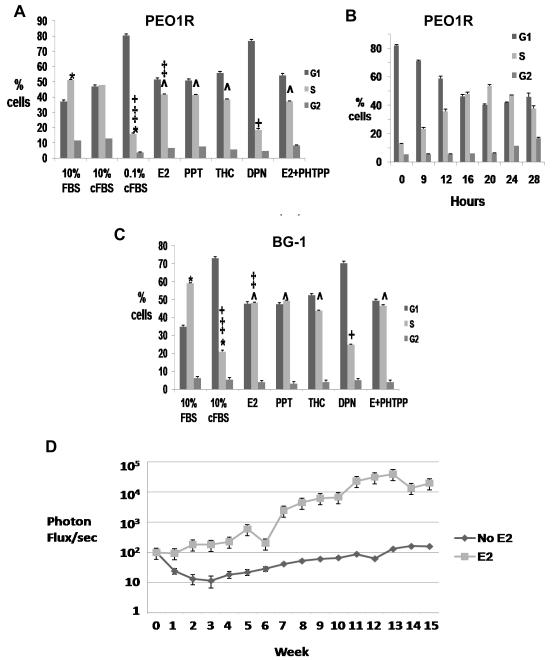
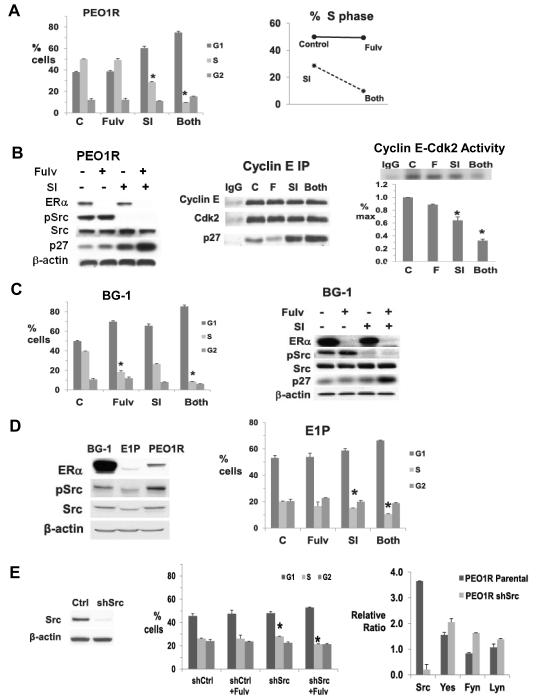
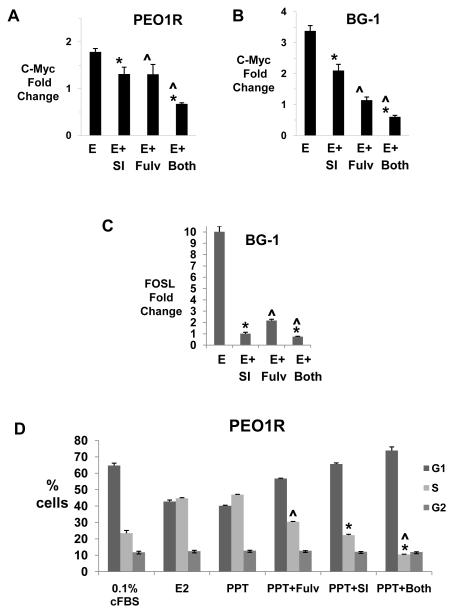
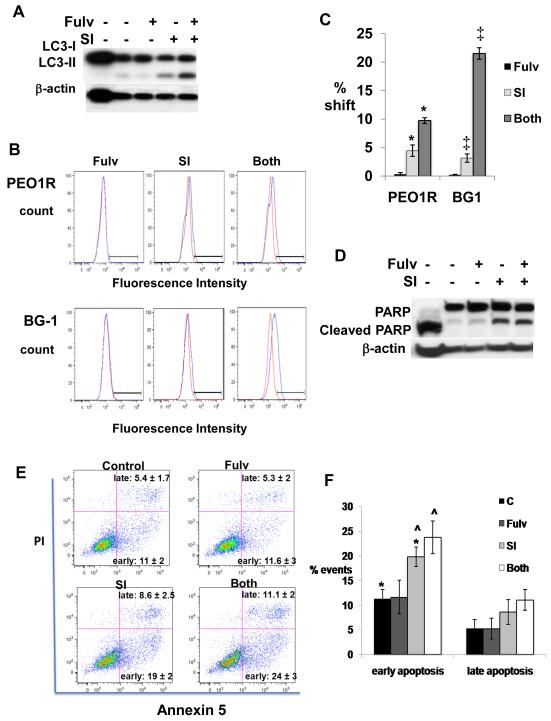
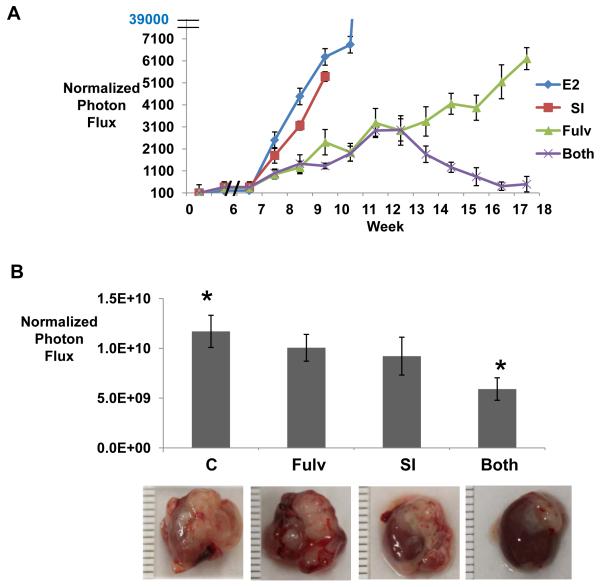
Results: Most primary ovarian cancers express ER. Src activity was greater in ovarian cancer lines than normal epithelial lines. Estrogen activated Src, ER-Src binding, and ER translocation from cytoplasm to nucleus. Estrogen-mediated mitogenesis was via ERα, not ERβ. While each alone had little effect, combined saracatinib and fulvestrant increased p27 and inhibited cyclin E-Cdk2 and cell-cycle progression. Saracatinib also impaired induction of ER-target genes c-Myc and FOSL1; this was greatest with dual therapy. Combined therapy induced autophagy and more effectively inhibited ovarian cancer xenograft growth than monotherapy.
Conclusions: Saracatinib augments effects of fulvestrant by opposing estrogen-mediated Src activation and target gene expression, increasing cell-cycle arrest, and impairing survival, all of which would oppose antiestrogen resistance in these ER+ ovarian cancer models. These data support further preclinical and clinical evaluation of combined fulvestrant and saracatinib in ovarian cancer.
©2012 AACR.
Figures
Similar articles
-
An ovarian cancer model with positive ER: Reversion of ER antagonist resistance by Src blockade.Oncol Rep. 2014 Sep;32(3):943-50. doi: 10.3892/or.2014.3284. Epub 2014 Jun 23. Oncol Rep. 2014. PMID: 24968896
-
Combined Src and ER blockade impairs human breast cancer proliferation in vitro and in vivo.Breast Cancer Res Treat. 2011 Jul;128(1):69-78. doi: 10.1007/s10549-010-1024-7. Epub 2010 Jul 29. Breast Cancer Res Treat. 2011. PMID: 20669046
-
Dual Src and MEK Inhibition Decreases Ovarian Cancer Growth and Targets Tumor Initiating Stem-Like Cells.Clin Cancer Res. 2018 Oct 1;24(19):4874-4886. doi: 10.1158/1078-0432.CCR-17-3697. Epub 2018 Jun 29. Clin Cancer Res. 2018. PMID: 29959144 Free PMC article.
-
New insights on the role of hormonal therapy in ovarian cancer.Steroids. 2013 Jun;78(6):530-7. doi: 10.1016/j.steroids.2013.01.008. Epub 2013 Feb 8. Steroids. 2013. PMID: 23402742 Free PMC article. Review.
-
Dual Drug Repurposing: The Example of Saracatinib.Int J Mol Sci. 2024 Apr 22;25(8):4565. doi: 10.3390/ijms25084565. Int J Mol Sci. 2024. PMID: 38674150 Free PMC article. Review.
Cited by
-
Role of c-Src in Carcinogenesis and Drug Resistance.Cancers (Basel). 2023 Dec 20;16(1):32. doi: 10.3390/cancers16010032. Cancers (Basel). 2023. PMID: 38201459 Free PMC article. Review.
-
Small molecule inhibitors targeting the cancers.MedComm (2020). 2022 Oct 13;3(4):e181. doi: 10.1002/mco2.181. eCollection 2022 Dec. MedComm (2020). 2022. PMID: 36254250 Free PMC article. Review.
-
Cigarette Smoke Mediates Nuclear to Cytoplasmic Trafficking of Transcriptional Inhibitor Kaiso through MUC1 and P120-Catenin.Am J Pathol. 2016 Dec;186(12):3146-3159. doi: 10.1016/j.ajpath.2016.08.011. Epub 2016 Oct 17. Am J Pathol. 2016. PMID: 27765636 Free PMC article.
-
VEGFA activates an epigenetic pathway upregulating ovarian cancer-initiating cells.EMBO Mol Med. 2017 Mar;9(3):304-318. doi: 10.15252/emmm.201606840. EMBO Mol Med. 2017. PMID: 28179359 Free PMC article.
-
A Phase I Study of the Non-Receptor Kinase Inhibitor Bosutinib in Combination with Pemetrexed in Patients with Selected Metastatic Solid Tumors.Curr Oncol. 2022 Dec 3;29(12):9461-9473. doi: 10.3390/curroncol29120744. Curr Oncol. 2022. PMID: 36547158 Free PMC article. Clinical Trial.
References
-
- Tummala MK, McGuire WP. Recurrent ovarian cancer. Clin Adv Hematol Oncol. 2005;3:723–36. - PubMed
-
- Langdon SP, Hirst GL, Miller EP, Hawkins RA, Tesdale AL, Smyth JF, et al. The regulation of growth and protein expression by estrogen in vitro: a study of 8 human ovarian carcinoma cell lines. J Steroid Biochem Mol Biol. 1994;50:131–5. - PubMed
-
- Langdon SP, Crew AJ, Ritchie AA, Muir M, Wakeling A, Smyth JF, et al. Growth inhibition of oestrogen receptor-positive human ovarian carcinoma by anti-oestrogens in vitro and in a xenograft model. Eur J Cancer. 1994;30A:682–6. - PubMed
-
- O’Donnell AJ, Macleod KG, Burns DJ, Smyth JF, Langdon SP. Estrogen receptor-alpha mediates gene expression changes and growth response in ovarian cancer cells exposed to estrogen. Endocr Relat Cancer. 2005;12:851–66. - PubMed
Publication types
MeSH terms
Substances
Grants and funding
LinkOut - more resources
Full Text Sources
Medical
Miscellaneous
