. 2012 Aug 15;4(147):147ra112.
doi: 10.1126/scitranslmed.3003778.

Targeted tumor-penetrating siRNA nanocomplexes for credentialing the ovarian cancer oncogene ID4

Affiliations

Targeted tumor-penetrating siRNA nanocomplexes for credentialing the ovarian cancer oncogene ID4

Yin Ren et al. Sci Transl Med. .

Erratum in

Abstract

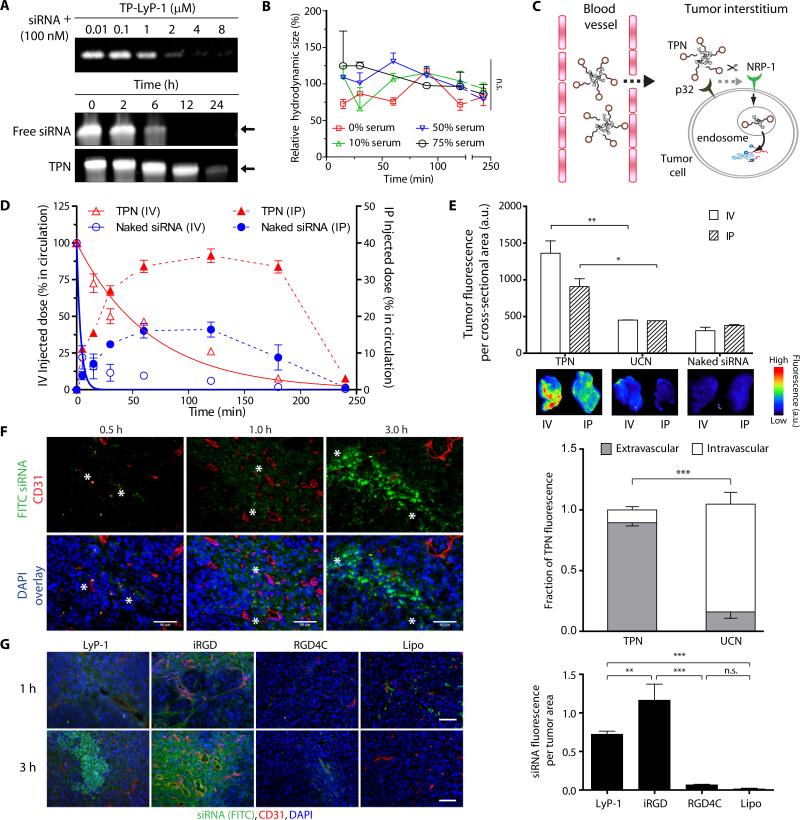
The comprehensive characterization of a large number of cancer genomes will eventually lead to a compendium of genetic alterations in specific cancers. Unfortunately, the number and complexity of identified alterations complicate endeavors to identify biologically relevant mutations critical for tumor maintenance because many of these targets are not amenable to manipulation by small molecules or antibodies. RNA interference provides a direct way to study putative cancer targets; however, specific delivery of therapeutics to the tumor parenchyma remains an intractable problem. We describe a platform for the discovery and initial validation of cancer targets, composed of a systematic effort to identify amplified and essential genes in human cancer cell lines and tumors partnered with a novel modular delivery technology. We developed a tumor-penetrating nanocomplex (TPN) that comprised small interfering RNA (siRNA) complexed with a tandem tumor-penetrating and membrane-translocating peptide, which enabled the specific delivery of siRNA deep into the tumor parenchyma. We used TPN in vivo to evaluate inhibitor of DNA binding 4 (ID4) as a novel oncogene. Treatment of ovarian tumor-bearing mice with ID4-specific TPN suppressed growth of established tumors and significantly improved survival. These observations not only credential ID4 as an oncogene in 32% of high-grade ovarian cancers but also provide a framework for the identification, validation, and understanding of potential therapeutic cancer targets.


Figures

Figure 1
Figure 1. ID4 is essential for the proliferation of ovarian cancer cells
(A) Median shRNA depletion scores for each amplified gene. Schematic shows the distribution of median shRNA scores (blue bars) in cell lines that harbor copy number gain (log2 copy number ratio > 0.3) of a given gene. shRNAs targeting the amplified gene (dots) are considered significant if p <0.05 (red line). This analysis was repeated for each of 1825 amplified genes in 63 recurrent regions of genomic amplification identified in primary ovarian tumors. (B) Amplification of ID4 in primary high-grade serous ovarian tumors. SNP array colorgram depicts genomic amplification of ID4 at chromosome 6p22 region in subsets of primary ovarian tumors, sorted on the basis of the degree of amplification. (C) Immunohistochemical analysis of ID4 performed on sections from tissue microarrays composed of primary human ovarian cancers (n=131) and normal tissues (n=85). (D) Effects of ID4 suppression by two different shRNAs on proliferation of human cancer cell lines (top) and relative levels of ID4 mRNA (bottom). Data are averages ± s.d. (n = 6 replicate measurements). 6p22-amplified lines are marked in red. *p<0.05 compared to shGFP (control), Student's t test. (E) FISH analysis of ID4 in ovarian cancer cells. (F) Potentiation of tumorigenicity by ID4 overexpression. IOSE-M cells expressing the indicated constructs were implanted subcutaneously into immunodeficient mice. The number of tumors formed/injections is indicated. HRASV12-expressing IOSE cells were used as a positive control. ***p<0.001, n.s., not significant, Fisher's exact test. (G) ID4 promotes anchorage-independent growth of IOSE-M (ovarian epithelial) and FTSEC-M (fallopian tube) cells. Data are averages ± s.d. (n = 6). **p<0.01, ***p<0.001 compared to respective vector control, Student's t test.
Figure 2
Figure 2. ID4 induces tumorigenicity that depends on HOXA9
(A) ID4 induces HOXA9 gene activity. Gene expression profiling and gene set enrichment analysis (GSEA) were performed on IOSE-M cells overexpressing ID4 or a control vector. All genes were ranked on the basis of the differential expression between cells expressing ID4 or a control vector. Black bars at the bottom of the figure indicate the location of genes in a NUP98-HOXA9 upregulated gene set (TAKEDA_TARGETS_of_NUP98_HOXA9_FUSION_3D_UP) (17) within the ranked list and the green curve indicates the running enrichment score for the gene set. (B) Quantitative RT-PCR analysis of HOXA9, HOXA7, and HOXA3 mRNA in IOSE-M cells overexpressing ID4 or a control empty vector. Data are averages ± s.d. (n = 6 replicate measurements). (C) Quantitative RT-PCR analysis of HOXA9, HOXA7, and HOXA3 mRNA in OVCAR-8 cells 3 days after infection with a control shGFP or two shRNAs targeting ID4. Data are averages ± s.d. (n = 6 replicate measurements). (D) Anchorage-independent growth of ID4-overexpressing IOSE-M cells in response to shHOXA9. Data are averages ± s.d. (n = 6). ***p<0.0001, Student's t test. (E) The effect of HOXA9 suppression onID4-induced tumorigenicity in immunodeficient mice. ID4-overexpressing IOSE-M cells expressing indicated shRNAs were subcutaneously implanted into immunodeficient mice. The number of tumors formed/injections is indicated. **p<0.01, Fisher's exact test. (F) Expression data from primary ovarian tumors with low ID4 expression levels (n = 44 samples) were compared to samples with high ID4 expression (n = 45). Thresholds were 1 s.d. below and above the mean expression of all the samples. At the bottom of the enrichment plots, black bars indicate the location of genes in a NUP98-HOXA9-downregulated gene set (TAKEDA_TARGETS_OF_NUP98_HOXA9_FUSION_10D_DN) (17). (G) ID4 amplification in ovarian tumors correlated with decreased p21WAF1/CIP1 activity. Expression profiling of primary ovarian tumors with matched copy number data was used to perform GSEA on amplified ID4 (log2 copy number ratio >0.3) and non-amplified ID4 samples (log2 copy number ratio <0). All genes were ranked by their differential expression (signal to noise) between 81 non-amplified and 109 amplified ID4 primary tumors. Black bars at the bottom of the figure indicate the location of genes in the p21WAF1/CIP1 target gene set (P21_P53_ANY_DN).
Figure 3
Figure 3. Characterization and activity of tumor-penetrating nanocomplexes (TPN)
(A) Schematic of the tandem peptide screen. siRNA was noncovalently bound to a library of 18 candidate tandem peptides bearing a fixed N-terminal cyclic tumor-penetration domain and variable C-terminal linear membrane translocation domains. The resulting nanocomplexes were assayed and selected for their cellular uptake, siRNA delivery, lack of immunogenicity, and receptor specificity in human cancer cell lines in vitro or in mouse models of human ovarian cancer. (B) The tandem peptide construct and various membrane translocation domains tested. (C) Gene silencing activity of tandem peptide-siGFP nanocomplexes in HeLa cells stably expressing GFP. Percent GFP silencing was calculated based on the geometric mean of GFP fluorescence intensity of the whole population relative to cells treated with media only. The lipofectamine control (Lipo) contained 100 nM GFP-siRNA. Data are averages ± s.d (n = 4 independent experiments). Inset: HeLa cell uptake of fluorescently labeled nanocomplexes was assessed by flow cytometry. Data are averages ± s.d (n = 4 independent experiments). (D) Receptor specificity of nanocomplex-mediated GFP silencing. Data are averages ± s.d (n = 6 independent experiments). **p<0.01; ***p<0.001, n.s., not significant, one-way ANOVA.
Figure 4
Figure 4. TPN mediated suppression of ID4 in p32-expressing ovarian cancer cells
(A) ID4 suppression by TPN-mediated siRNA delivery in vitro. Immunoblot of ID4 in two 6p22-amplified ovarian cancer cell lines, OVCAR-4 and OVCAR-8, which were treated with TPN containing one of two ID4-specific siRNAs or a control siRNA targeting GFP (siGFP). α-Tubulin was used as a loading control. (B) Effects of ID4 suppression on cell proliferation. Data are averages ± s.d. (n = 4 independent experiments). ***p<0.001, one-way ANOVA. (C) Effects of ID4 suppression in OVCAR-8 cells. The percentages of apoptotic and S-phase cells were calculated. Data are averages ± s.d. (n = 3 independent experiments). *p<0.05, n.s., not significant. one-way ANOVA. (D) Intercalation of TO-PRO-3, a nucleic acid-binding dye, into siRNA in the presence of TPN at various pH. Fluorescence was detected at 640/680 nm (ex/em). Data are averages ± s.d. (n = 4 independent experiments). **p<0.01, ***p<0.001, one-way ANOVA and Tukey post-hoc tests.
Figure 5
Figure 5. TPN homing in vivo
(A) Serum stability of TPN. (Top) Agarose gel analysis of siRNA complexed to TP-LyP-1 at varying molar ratios. (Bottom) Gel electrophoresis of free siRNA and TPN in mouse serum at 37°C at the indicated times. Arrow indicates expected position of intact siRNA (14 kDa). (B) Dynamic light scattering measurements of TPN in varying concentrations of mouse serum at 37°C over time. The hydrodynamic diameter of TPN in each serum concentration over time is normalized to its size in PBS (0% serum) at time 0 min. Data are averages ± s.d. (n = 6 independent measurements). n.s., not significant, one-way ANOVA. (C) Schematic of TPN penetration and targeted delivery of siRNA into the cytosol of cancer cells. (D) In vivo circulation of TPN compared with naked siRNA against GFP upon intravenous (IV) or intraperitoneal (IP) administration. Fluorescence of siRNA was detected in the blood drawn retro-orbitally. Data are averages ± s.d. (n = 3). (E) Quantification of siRNA fluorescence and corresponding fluorescence images of MDA-MB-435 whole-tumor explants harvested 4 h after injection of TPN, UCN, or naked siRNA, either IV or IP. Data are averages ± s.d. (n=6). *p<0.05; **p<0.01, one-way ANOVA. (F) Histological analysis of time-dependent homing of TPN carrying FITC-labeled siRNA (asterisks) in relation to blood vessels in mice bearing human OVCAR-8 tumor xenografts. Nuclei were stained with DAPI. Tumor vasculature is CD31+. Scale bars, 50 μm. On the right, extravascular and intravascular fractions of TPN were quantified from the fluorescence images. Data are averages ± s.d., from representative sections of 6 independent tumors. ***p<0.001 by two-tailed Student's t-test. (G) Tumor parenchyma penetration by TPN with LyP-1 and iRGD homing domains, non-penetrating nanocomplex targeted by RGD4C peptide, and lipofectamine. Nanocomplexes were injected intravenously and OVCAR-8 tumors were stained 1 or 3 h later (n = 6 per formulation). Scale bars, 50 μm. On the right, tumor fluorescence was quantified. Data are averages ± s.d. from 6 randomly selected views per condition. **p<0.01; ***p<0.001, n.s., not significant, by one-way ANOVA with Tukey post-hoc tests.
Figure 6
Figure 6. Subcutaneous tumor treatment with TPN/siID4
(A, B) Efficacy of TPN-mediated delivery of siID4 in vivo. ID4 mRNA (A) and burden of subcutaneous OVCAR-4 xenografts (B) after treatments with the indicated formulations every 3 days for 25 days (arrowheads). Control cohorts received either TP-LyP-1 without siRNA or TPN/siGFP. Inset shows the experimental timeline. Treatment period is shaded in gray. Data are averages ± s.d. (n = 8-10 tumors per group). ***p<0.001, n.s., not significant, one-way ANOVA. (C) CDKN1A mRNA levels from tumors at day 60, relative to saline control. Data are averages ± s.d. **p<0.01; ***p<0.001, n.s., not significant, one-way ANOVA. (D) Weight of OVCAR-4 tumors at day 60. Data are averages ± s.d. (n = 5-10 tumors per cohort). *p<0.05, **p<0.01, n.s., not significant, one-way ANOVA. (E) Quantification of TUNEL staining intensities from 6-10 randomly selected OVCAR-4 tumor sections (n = 5 per treatment group) after 30 days of TPN treatment. Data are averages ± s.d. **p<0.01, one-way ANOVA
Figure 7
Figure 7. Orthotopic tumor treatment with TPN/siID4
(A) Therapeutic efficacy of TPN in mice bearing disseminated orthotopic OVCAR-8 tumors. Mice were treated i.p. every 3 days for 14 days and then once weekly thereafter for 3 weeks with TPN/siID4, saline, TPN/siGFP, and UCN/siID4 (arrowheads). Inset shows the experimental timeline. Total tumor burden was followed by bioluminescence imaging, with images from day 60 shown. Data are means ± s.d. (n = 5 mice per group). *p<0.05; ***p<0.001, n.s., not significant, one way ANOVA. (B) Kaplan-Meier plot of overall survival of the cohorts shown in (D). *p<0.05 by Log-rank (Mantel-Cox) Test. (C) Quantification of ID4, p32, and TUNEL intensities from OVCAR-8 tumors on day 4. Intensity values are normalized to that of saline controls. Data are averages ± s.d. (n = 5 per treatment group). **p<0.01, ***p<0.001, n.s., not significant, one-way ANOVA.

References

    1. The Cancer Genome Atlas Research Network Integrated genomic analyses of ovarian carcinoma. Nature. 2011 Jun 30;474:609. - PMC - PubMed
    1. Cheung HW, et al. Systematic investigation of genetic vulnerabilities across cancer cell lines reveals lineage-specific dependencies in ovarian cancer. Proc Natl Acad Sci U S A. 2011 Jul 26;108:12372. - PMC - PubMed
    1. Elbashir SM, et al. Duplexes of 21-nucleotide RNAs mediate RNA interference in cultured mammalian cells. Nature. 2001 May 24;411:494. - PubMed
    1. Fire A, et al. Potent and specific genetic interference by double-stranded RNA in Caenorhabditis elegans. Nature. 1998 Feb 19;391:806. - PubMed
    1. Whitehead KA, Langer R, Anderson DG. Knocking down barriers: advances in siRNA delivery. Nat Rev Drug Discov. 2009 Feb;8:129. - PMC - PubMed

Publication types

MeSH terms

Substances