. 2012 Oct 5;287(41):34372-85.
doi: 10.1074/jbc.M111.325332. Epub 2012 Aug 15.

Polycomb antagonizes p300/CREB-binding protein-associated factor to silence FOXP3 in a Kruppel-like factor-dependent manner

Affiliations

Polycomb antagonizes p300/CREB-binding protein-associated factor to silence FOXP3 in a Kruppel-like factor-dependent manner

Yuning Xiong et al. J Biol Chem. .

Abstract

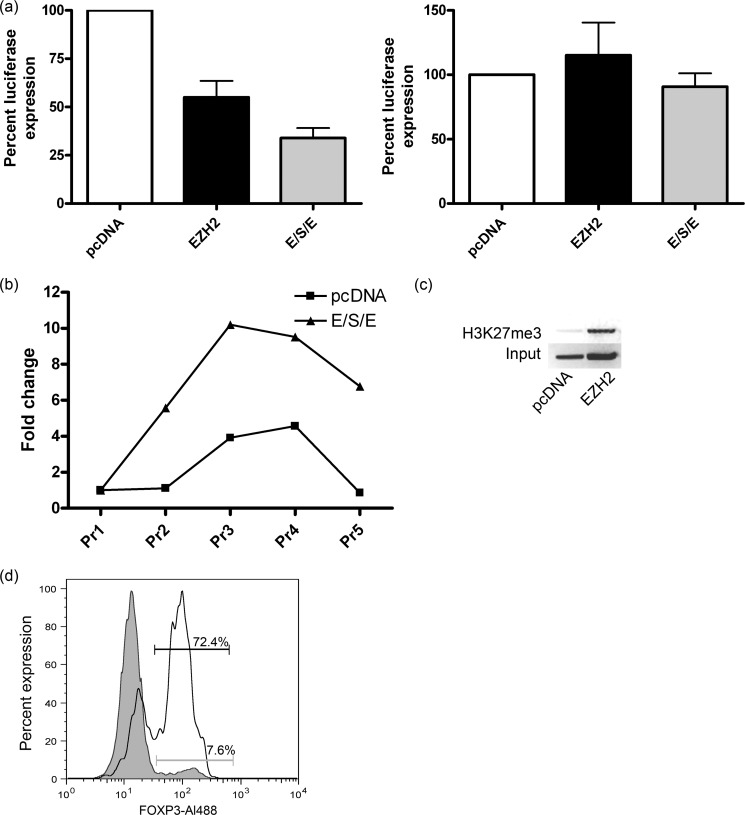
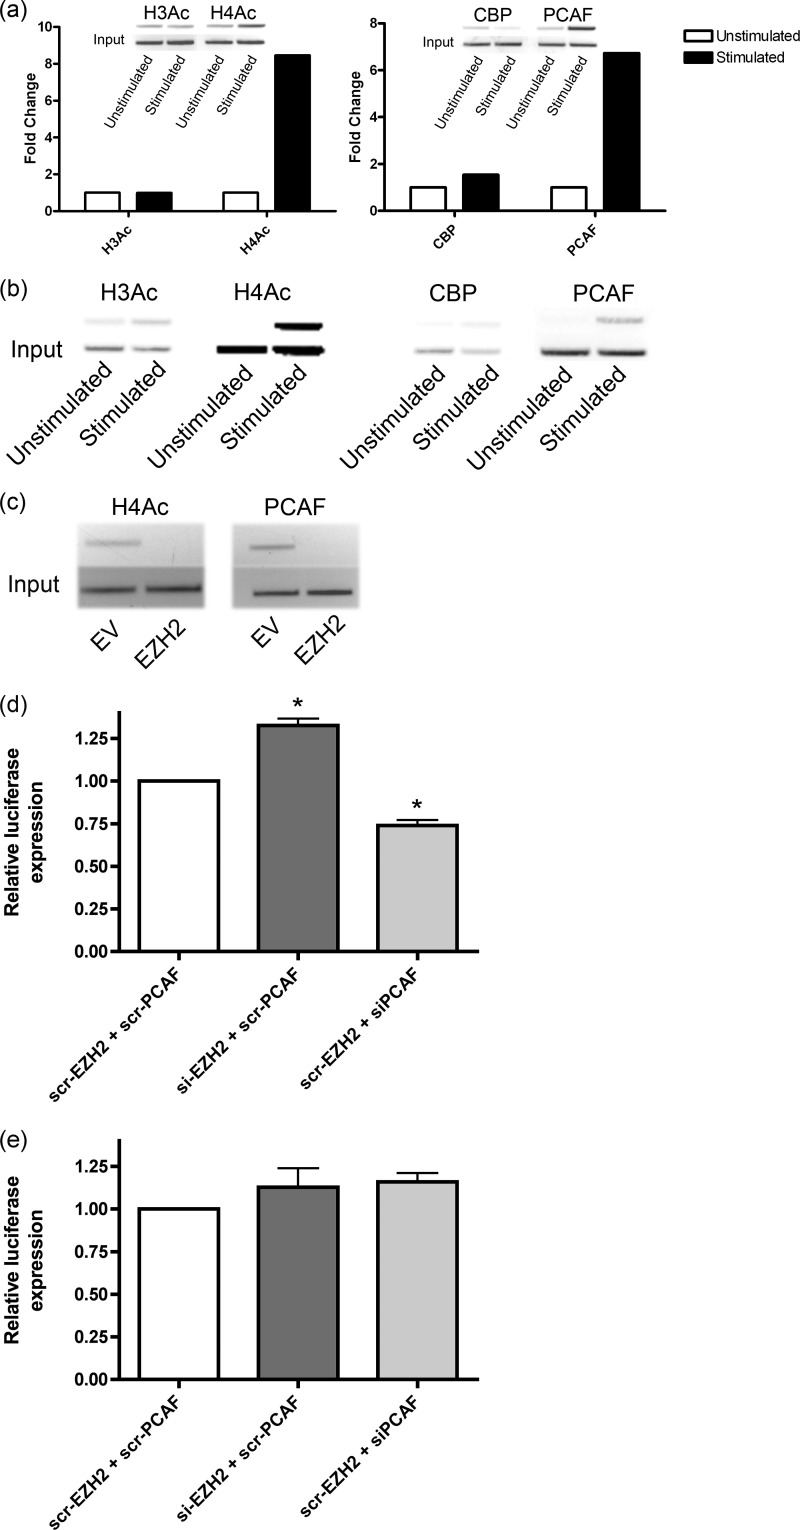
Inducible gene expression underlies the epigenetically inherited differentiation program of most immune cells. We report that the promoter of the FOXP3 gene possesses two distinct functional states: an "off state" mediated by the polycomb histone methyltransferase complex and a histone acetyltransferase-dependent "on state." Regulating these states is the presence of a Kruppel-like factor (KLF)-containing Polycomb response element. In the KLF10(-/-) mouse, the FOXP3 promoter is epigenetically silenced by EZH2 (Enhancer of Zeste 2)-mediated trimethylation of Histone 3 K27; thus, impaired FOXP3 induction and inappropriate adaptive T regulatory cell differentiation results in vitro and in vivo. The epigenetic transmittance of adaptive T regulatory cell deficiency is demonstrated throughout more than 40 generations of mice. These results provide insight into chromatin remodeling events key to phenotypic features of distinct T cell populations.


Figures

FIGURE 1.
FIGURE 1.
Bioinformatics analysis predicts existence of KLF-PRE within mouse and human FOXP3 homologues. DNA-binding motifs were analyzed using consensus sequences defined above within the first 1 kb upstream of the transcription start site. The mouse consensus sites used were YY1 (GACATNTT, VDCCATNWY, or CGGCATNTT) (52), GAGA factor (GAGAG; GAF) (53), and Sp1/KLF (CACCC) (54). Regions of conserved identity are marked in green, and colors denote nucleotide identity: red, A; blue, C; yellow, G; and green, T. For pairwise alignment of mouse and human FOXP3, the boxed region of the mouse FOXP3 promoter denotes the location of maximal Polycomb-mediated repression subsequently identified by ChIP experiments.
FIGURE 2.
FIGURE 2.
PRC2 complex silences the FOXP3 core promoter. a, luciferase counts represented relative to empty vector control (pcDNA, open bar) upon transfection of EZH2 alone or the entire PRC2 complex EZH2, Suz12, and EED (E/S/E). Identical analysis in the J-FLP control cell line (right panel). b, J-FOXP3-E1 cells transfected with PRC2 demonstrate enhanced H3K27me3 marks at the FOXP3 core promoter. Five primer pairs were designed ∼200 bp apart covering the FOXP3 core genomic insert (Pr1–5). The center of the core promoter demonstrated the highest H3K27me3 marks. Cells transfected with empty vector (pcDNA) serve as the relevant control. The results are presented controlled by their own input. c, semiquantitative PCR analysis of the expression of FOXP3 from the product of ChIP for H3K27me3 in EZH2 transduced or pcDNA transduced primary mouse naïve T cells. d, flow cytometry analysis of primary T cells transduced with EZH2 (shaded histogram) or empty vector (open histogram) for FOXP3 after 7 days of stimulation. The data represent at least three independent experiments.
FIGURE 3.
FIGURE 3.
Histone methylation marks associated with PRC2 complex predict FOXP3 expression in primary CD4+ lymphocytes. a, inset gel, left panel, representative DNA gel for PCR analysis of the expression of FOXP3 in cell fractions post-immunoprecipitation for H3K27 methylation in primary CD4+ splenocytes isolated on the basis of CD62 ligand expression and FOXP3 transcriptional activity (GFP). The accompanying histogram represents the optical density of the bands normalized to CD62L+ GFP+. The histogram on the right demonstrates quantitative real time PCR analysis of the expression of FOXP3 in cell fractions post-immunoprecipitation for H3K27 methylation in primary CD4+ splenocytes isolated on the basis of CD62 ligand expression and FOXP3 transcriptional activity (GFP), relative to CD62L+ GFP+; the results are presented controlled to FOXP3 expression of preimmunoprecipitated sample. The data represent three independent experiments (means and S.D.). b and c, inset gels, left panels, demonstrate representative DNA gels for PCR using FOXP3 specific primers in samples post-precipitation for H3K27 methylation marks (b) or EZH2 (c) in primary CD4+ CD62L+ cells post-activation for 14 days and isolated on the basis of FOXP3 transcriptional activity (GFP). The left panels represent the relative optical density normalized to GFP+. The right panels demonstrate the quantitative real time PCR analysis of the expression of FOXP3 in cell fractions post-immunoprecipitation for H3K27me3 or EZH2; the results are presented controlled to FOXP3 expression of preimmunoprecipitated sample. The data represent three independent experiments (means and S.D.).
FIGURE 4.
FIGURE 4.
Activation of the FOXP3 core promoter is associated with histone 4 acetylation and the histone acetyltransferase PCAF. a, quantitative real time PCR analysis of the expression of FOXP3 in cell fractions post-immunoprecipitation for histone 3 and histone 4 acetylation states (left panel) and the histone acetyltransferases CBP and PCAF (right panel) in primary murine CD4+ CD62L+ cells post-activation for 18 h; the results are presented controlled to FOXP3 expression of preimmunoprecipitated sample, relative to CD4 + 62L+ GFP+. Inset gel, left panel, representative DNA gel for PCR using FOXP3 specific primers in samples post-precipitation for histone acetylation states or HATs. b, DNA gel for PCR using FOXP3 specific primers in samples post-precipitation for histone acetylation states or HATs in human CD4+RA+ peripheral T cells post-activation for 18 h. c, DNA gel for PCR using FOXP3 specific primers in samples post-precipitation for histone 4 acetylation and PCAF using DNA isolated from CD4+ splenocytes transduced with EZH2 or empty vector (EV) and stimulated to produce FOXP3 for 5 days. The data are representative of three independent experiments. d, EZH2 and PCAF compete for regulatory control of FOXP3. Luciferase counts represented relative to siRNA scrambled control (scr-EZH2+scr-PCAF, open bar) upon transfection of siRNA directed against EZH2 (si-EZH2+scr-PCAF) or PCAF (scr-EZH2+siPCAF). The data represent three independent experiments (means and S.D.; *, p < 0.05). e, regulatory control of FOXP3 is lost upon deletion of Polycomb response element. Luciferase counts represented relative to siRNA scrambled control (scr-EZH2+scr-PCAF, open bar) upon transfection of siRNA directed against EZH2 (si-EZH2+scr-PCAF) or PCAF (scr-EZH2+siPCAF). The data represent three independent experiments.
FIGURE 5.
FIGURE 5.
KLF10, present on the core promoter, recruits PCAF-mediated histone acetylation of the FOXP3 core promoter and relieves H3K27 methylation. a, DNA gel for PCR using FOXP3 specific primers in samples post-precipitation for KLF10 in murine naïve CD4+ splenocytes (left two lanes) or human CD4+RA+ peripheral T cells (right two lanes) transfected with either empty vector (pcDNA) or KLF10-His. b, inset gel, left panel, representative DNA gel for PCR using FOXP3 specific primers in DNA samples in primary CD4+ CD62L+ cells isolated from spleens of WT (left panel) or KLF10-deficient (KFL10−/−) animals post-precipitation for H3K27me3. The left panel represents optical density of DNA bands. The right panel represents quantitative real time PCR analysis of the expression of FOXP3 in cell fractions post-immunoprecipitation for H3K27me3 in primary CD4+ CD62L+ cells isolated from spleens of WT (left column) or KLF10-deficient (KFL10−/−) animals; the results are presented controlled to FOXP3 expression of preimmunoprecipitated sample (input). c, DNA gel for PCR using FOXP3 specific primers in samples post-immunoprecipitation for H3K27me3 in murine CD4+ splenocytes activated for 5 days isolated from WT (left lane) or KLF10−/− (right lane) mice. d, FOXP3 protein by flow cytometry in CD4+ splenocytes activated for 5 days isolated from WT (left panel) or KLF10−/− (right panel) mice. e, DNA gel for PCR using FOXP3 specific primers in samples post-precipitation for H4 acetylation, PCAF, or CBP in murine naïve WT CD4+ splenocytes (left two lanes) or murine naïve KLF10-deficient (KLF10−/−) CD4+ splenocytes (right two lanes). The data are representative of at least three independent experiments.
FIGURE 6.
FIGURE 6.
Adaptive Treg cells fail to develop in the KLF10-deficient mouse. a, flow cytometric analysis of splenocytes, mesenteric lymph nodes (MLN) and lamina propria lymphocytes (LPL) for FOXP3+ cells. The histograms represent FOXP3+ cells expressed as percentages of CD4+ lymphocytes. b, flow cytometric analysis for FOXP3 of CD4 + 62L+ splenocytes isolated from WT or KLF10 deficient (KLF10−/−) mice after culture for 1 week in conditions established to induce Treg cells.
FIGURE 7.
FIGURE 7.
KLF10-deficient mice exhibit extreme susceptibility to DSS colitis. a–c, tabulation of weight change (a), clinical disease activity scores (b), and histologic disease activity index (c) in DSS-exposed (closed symbols) versus water-fed (open symbols) mice demonstrate significantly more severe colitis in KLF10-deficient (closed squares) versus wild type (closed circles) animals. d and e, representative histologic section from the colon of a wild type mouse (d) compared with the significant inflammation and ulceration demonstrated in the colon of a KLF10-deficient mouse (e). The data are from n = 7 mice (means and S.D.).

Similar articles

Cited by

References

    1. Curotto de Lafaille M. A., Lafaille J. J. (2009) Natural and adaptive foxp3+ regulatory T cells. More of the same or a division of labor? Immunity 30, 626–635 - PubMed
    1. Chen W., Jin W., Hardegen N., Lei K. J., Li L., Marinos N., McGrady G., Wahl S. M. (2003) Conversion of peripheral CD4+CD25− naive T cells to CD4+CD25+ regulatory T cells by TGF-β induction of transcription factor Foxp3. J. Exp. Med. 198, 1875–1886 - PMC - PubMed
    1. Li M. O., Sanjabi S., Flavell R. A. (2006) Transforming growth factor-β controls development, homeostasis, and tolerance of T cells by regulatory T cell-dependent and -independent mechanisms. Immunity 25, 455–471 - PubMed
    1. Li M. O., Wan Y. Y., Flavell R. A. (2007) T cell-produced transforming growth factor-beta1 controls T cell tolerance and regulates Th1- and Th17-cell differentiation. Immunity 26, 579–591 - PubMed
    1. Marie J. C., Letterio J. J., Gavin M., Rudensky A. Y. (2005) TGF-β1 maintains suppressor function and Foxp3 expression in CD4+CD25+ regulatory T cells. J. Exp. Med. 201, 1061–1067 - PMC - PubMed

Publication types

MeSH terms

Substances