Impact of response duration on multisensory integration
- PMID: 22896723
- PMCID: PMC3545173
- DOI: 10.1152/jn.00286.2012
Impact of response duration on multisensory integration
Abstract
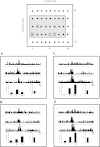
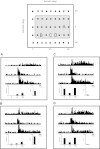
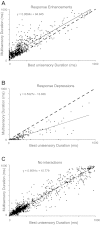
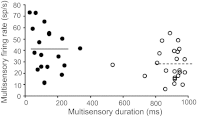
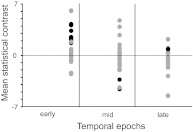
Multisensory neurons in the superior colliculus (SC) have been shown to have large receptive fields that are heterogeneous in nature. These neurons have the capacity to integrate their different sensory inputs, a process that has been shown to depend on the physical characteristics of the stimuli that are combined (i.e., spatial and temporal relationship and relative effectiveness). Recent work has highlighted the interdependence of these factors in driving multisensory integration, adding a layer of complexity to our understanding of multisensory processes. In the present study our goal was to add to this understanding by characterizing how stimulus location impacts the temporal dynamics of multisensory responses in cat SC neurons. The results illustrate that locations within the spatial receptive fields (SRFs) of these neurons can be divided into those showing short-duration responses and long-duration response profiles. Most importantly, discharge duration appears to be a good determinant of multisensory integration, such that short-duration responses are typically associated with a high magnitude of multisensory integration (i.e., superadditive responses) while long-duration responses are typically associated with low integrative capacity. These results further reinforce the complexity of the integrative features of SC neurons and show that the large SRFs of these neurons are characterized by vastly differing temporal dynamics, dynamics that strongly shape the integrative capacity of these neurons.
Figures



Similar articles
-
Heterogeneity in the spatial receptive field architecture of multisensory neurons of the superior colliculus and its effects on multisensory integration.Neuroscience. 2014 Jan 3;256:147-62. doi: 10.1016/j.neuroscience.2013.10.044. Epub 2013 Oct 30. Neuroscience. 2014. PMID: 24183964 Free PMC article.
-
The influence of visual and auditory receptive field organization on multisensory integration in the superior colliculus.Exp Brain Res. 2001 Aug;139(3):303-10. doi: 10.1007/s002210100772. Exp Brain Res. 2001. PMID: 11545469
-
Representation and integration of multiple sensory inputs in primate superior colliculus.J Neurophysiol. 1996 Aug;76(2):1246-66. doi: 10.1152/jn.1996.76.2.1246. J Neurophysiol. 1996. PMID: 8871234
-
Spatial receptive field organization of multisensory neurons and its impact on multisensory interactions.Hear Res. 2009 Dec;258(1-2):47-54. doi: 10.1016/j.heares.2009.08.003. Epub 2009 Aug 19. Hear Res. 2009. PMID: 19698773 Free PMC article. Review.
-
Neural mechanisms for synthesizing sensory information and producing adaptive behaviors.Exp Brain Res. 1998 Nov;123(1-2):124-35. doi: 10.1007/s002210050553. Exp Brain Res. 1998. PMID: 9835401 Review.
Cited by
-
Measuring multisensory integration: from reaction times to spike counts.Sci Rep. 2017 Jun 8;7(1):3023. doi: 10.1038/s41598-017-03219-5. Sci Rep. 2017. PMID: 28596602 Free PMC article. Review.
-
Integration of visual and whisker signals in rat superior colliculus.Sci Rep. 2018 Nov 6;8(1):16445. doi: 10.1038/s41598-018-34661-8. Sci Rep. 2018. PMID: 30401871 Free PMC article.
-
Multisensory response modulation in the superficial layers of the superior colliculus.J Neurosci. 2014 Mar 19;34(12):4332-44. doi: 10.1523/JNEUROSCI.3004-13.2014. J Neurosci. 2014. PMID: 24647954 Free PMC article.
-
Inhibitory interneurons in visual cortical plasticity.Cell Mol Life Sci. 2016 Oct;73(19):3677-91. doi: 10.1007/s00018-016-2264-4. Epub 2016 May 18. Cell Mol Life Sci. 2016. PMID: 27193323 Free PMC article. Review.
References
-
- Anastasio TJ, Patton PE, Belkacem-Boussaid K. Using Bayes' rule to model multisensory enhancement in the superior colliculus. Neural Comput 12: 1165–1187, 2000 - PubMed
-
- Avillac M, Deneve S, Olivier E, Pouget A, Duhamel JR. Reference frames for representing visual and tactile locations in parietal cortex. Nat Neurosci 8: 941–949, 2005 - PubMed
-
- Burnett LR, Stein BE, Chaponis D, Wallace MT. Superior colliculus lesions preferentially disrupt multisensory orientation. Neuroscience 124: 535–547, 2004 - PubMed
Publication types
MeSH terms
Grants and funding
LinkOut - more resources
Full Text Sources
Miscellaneous

