. 2012 Apr 30;2012(2):108-118.
doi: 10.4172/2165-74.

Routing of Biomolecules and Transgenes' Vectors in Nuclei of Oocytes

Affiliations

Routing of Biomolecules and Transgenes' Vectors in Nuclei of Oocytes

Marek Malecki et al. J Fertili In Vitro. .

Abstract

The molecular architecture of Nuclear Pore Complexes (NPCs), as well as the import and export of molecules through them, has been intensively studied in a variety of cells, including oocytes. However, the structures and mechanisms, involved in the transport of molecules beyond the NPCs, remained unclear, until now. The specific aim of this work was, therefore, to determine, if there exist any intranuclear structures in continuum with the NPCs. This information could help in explaining the mechanisms, which propel the distribution of biomolecules and vectors inside the cell nuclei.To attain this aim, we used rapid cryo-immobilization to capture molecular processes of living cells with millisecond resolution. We pursued molecular imaging, including electron energy loss spectroscopy and energy dispersive x-ray spectroscopy, to reveal structures with nanometer spatial resolution. We also bioengineered single chain variable fragments to track biomolecules and transgenes' constructs.Herein, we reveal the Nuclear Routing Networks (NRNs) in the oocytes of Xenopus laevis. The NRNs originate at and extend from the tops of intranuclear baskets of the NPCs to interconnect them, while creating a complex, intra-nuclear, three-dimensional architecture. The NRNs guide the export of both tRNA, as well as the Nuclear Export Signal (NES) equipped vectors, from the nuclei. Moreover, the NRNs guide the import of both nucleoplasmin, as well as the Nuclear Localization Signals (NLS) modified transgenes' vectors, into the nuclei. The vectors equipped with these NLS and NES shuttle back and forth through the NPCs and NRNs.To summarize, we reveal the NRN, which functions as the guided distribution system in the Xenopus laevis oocytes' nuclei. We further proceed with the identification of its molecular components.


Conflict of interest statement

Conflict of interest

The authors declare no conflict of interest.

Figures

Figure 1
Figure 1
The Xenopus laevis oocytes were defolliculated and stored (a). After spinning, which aimed at moving the nucleus to the pole, the transgenes vectors and biomolecules, equipped with the NLS and NES, were microinjected into the cytoplasmic or intra-nuclear compartments of oocytes (b). Some of the microinjected oocytes were cryo-immobilized for the trafficking and molecular imaging studies. The nuclei from other oocytes were isolated (c). The nuclei were attached to carriers and wide opened to release nucleoplasm (d). The nuclear envelopes with the retained NPCs and NRNs were available for molecular imaging (e).
Figure 2
Figure 2
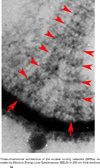
The intra-nuclear surface of the NE was exposed by gentle dissolving chromatin gel. The nuclear envelope was isolated in LSB, attached to a modified (sticky), glass chip, extracted with 0.1% Triton X-100 and fixed with 1% glutaraldehyde in LSB, postfixed with 1% aqueous osmium tetroxide, critical point dried, followed by cryo-sputter coating with Pt. It was imaged in the FESEM operated at 1.5kV. Entries into the nucleus through the NPCs are pointed with the red arrows. The NRNs project from the tops of the NPCs and show regular 50 nm periodicities pointed with red arrow-heads. The NRNs inter-connect to form a network. Lamins are marked with red stars. Horizontal field width 1820 nm.
Figure 3
Figure 3
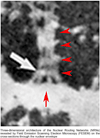
a: This oocyte was rapidly cryo-immobilized, after perinuclear microinjection with the NLS carrying transgenes. It was further processed by freeze-substitution, embedding, and cutting 250 nm thick sections. The image was acquired at zero loss setting of the energy loss energy spectrometer (EELS). The arrows point to the entries into the nucleus through the NPCs. Bundles of long thin filaments stretch from tops of NPC into the nuclear interior to form the NRNs. Along their long axes, there are “necklace-like “structures periodically distributed along the filaments. The heavily electron-dense dots suggest the vectors trafficking through the NRNs. Horizontal field width 450 nm. b: This oocyte was chemically fixed. It was further processed by embedding, cutting 250 nm thick sections, and staining with uranyl acetate and lead citrate. The image was acquired at the 1MeV HVEM. The arrows point to the entries into the nucleus through the NPCs. Horizontal field width 2030 nm.
Figure 3
Figure 3
a: This oocyte was rapidly cryo-immobilized, after perinuclear microinjection with the NLS carrying transgenes. It was further processed by freeze-substitution, embedding, and cutting 250 nm thick sections. The image was acquired at zero loss setting of the energy loss energy spectrometer (EELS). The arrows point to the entries into the nucleus through the NPCs. Bundles of long thin filaments stretch from tops of NPC into the nuclear interior to form the NRNs. Along their long axes, there are “necklace-like “structures periodically distributed along the filaments. The heavily electron-dense dots suggest the vectors trafficking through the NRNs. Horizontal field width 450 nm. b: This oocyte was chemically fixed. It was further processed by embedding, cutting 250 nm thick sections, and staining with uranyl acetate and lead citrate. The image was acquired at the 1MeV HVEM. The arrows point to the entries into the nucleus through the NPCs. Horizontal field width 2030 nm.
Figure 4
Figure 4
The oocytes were rapidly cryo-immobilized after microinjection of the transgene vectors, embedded, sectioned perpendicular to the nuclear envelope, de-embedded, and cryo-sputter coated with Pt/C. The entry into the nucleus through the NPC is pointed with the red arrow. The intra-nuclear ring of the NPC basket is pointed with the white arrow. The periodicities along the NRN are pointed with the red arrow heads. Horizontal field width 345 nm.
Figure 5
Figure 5
It illustrates a graphic interpretation of the NRN after the complete removal of chromatin and nucleoplasm. This model was created based upon the data acquired with 3 different techniques of molecular imaging presented in this study.
Figure 6
Figure 6
a–d: The NLS guided transgene vectors consisting of the scFv (anchoring the closed, circular, double stranded plasmid DNA) and metal binding domain (chelating Gd) were microinjected into the perinuclear space of the oocyte. After 1h, the oocytes were rapidly cryo-immobilized, freeze-substituted, epon embedded, and sectioned. An overview of the NPC and NRN architecture was acquired at zero-loss setting of the EELS on the HB505 FESTEM. (a) The complete elemental spectrum was acquired for every pixel of the scan with the EDXS. This created the elemental spectra database for this scan - the spectrum of one pixel shown as an example (peaks of Gd, C, O are prominent). (b) The spectrum was gated only for Gd and extracted from the complete data base to create the map of the elemental distribution. (c) This elemental map was equivalent to the map of the transgene vectors’ distribution. The map of the vectors’ distribution (from “c”) is overlapped over the architecture of the NPCs and NRNs (from “a”) to determine location of the vectors in the oocyte’s compartments. (d) Many electron-dense beads were eliminated as the false positive in the TEM, due to the ability to identify the true vectors based upon the elemental map. Horizontal field width in a,c,d 540 nm.
Figure 7
Figure 7
The NES-modified transgenes’ vectors were microinjected into the oocyte nuclei. Every 45 minutes from the time of microinjections, the oocytes were rapidly cryo-immobilized, processed, and analyzed as in the figure 6. The concentrations were measured and normalized against the counts at the zero time as 100%. Series 1 - counts of the NES-modified vectors present in the oocyte nucleus. Series 2 - counts for the vectors in the NRNs and NPCs. Series 3 - counts of the vectors without modification with the NES present in the oocyte nucleus. Series 4 - counts for the non-NES-modified vectors in the NRNs and NPCs. The concentration in the intranuclear space was rapidly falling after microinjections. The concentration in the NPCs and NRNs showed the gradual increase, which followed by the reduction indicative of the passage of the vectors through the NRNs. The concentrations of the transgene vectors were constantly increasing outside of the nuclei as the result of the constant export of the vectors driven by the NES. The concentrations of the vectors which were not modified with the NES gradually reduced due to diffusion, but they did not appear in the NRN and NPC or cytoplasm.
Figure 8
Figure 8
The cytoplasm of the oocytes was microinjected with the NLS-modified transgenes’ vectors. The oocytes were cryo-immobilized and analyzed as in the figure 7. Series 1 - counts of the NLS-modified vectors present in the oocyte cytoplasm. Series 2 - counts for the vectors imported from the cytoplasm into the NRNs and NPCs. Series 3 - counts in the cytoplasm of the vectors, which were not modified with NLS. Series 4 - counts in the NRNs and NPCs of the non-modified vectors. The vectors’ concentration in the perinuclear area of cytoplasm was gradually falling, while the concentration in the NRN and NPCs was increasing. This was indicative of the vectors’ entry on the route to the nucleoplasm. The concentrations of the vectors which were not modified with the NLS gradually reduced in the cytoplasm, but they did not appear in the NRN and NPC.
Figure 9
Figure 9
The tRNAs were microinjected into the oocyte nuclei. The oocytes were cryo-immobilized and analyzed at the same time intervals as in the figure 7. The concentrations were measured and normalized against the counts at the zero time as 100%. Series 1 - counts of the tRNA measured in the oocytes nucleus. Series 2 - counts for the tRNA in the NRNs and NPCs. Series 3 - counts of the control RNA measured in a unit volume in the oocyte nucleus. Series 4 - counts of the control RNA in the NRNs and NPCs. The concentration in the intranuclear space was falling after microinjections, while the concentration in the NRN and NPCs gradually increased with the increased passage. The concentrations of the tRNA in the cytoplasm were constantly increasing. The concentration in the intranuclear space was falling after microinjections, while the concentration in the NRN and NPCs gradually increased with the increased passage. The concentrations of the tRNA in the cytoplasm were constantly increasing.
Figure 10
Figure 10
The nucleoplasmin modified with reporters was microinjected into the oocytes’ cytoplasm. The oocytes were cryo-immobilized and analyzed at the same time intervals as in the figure 7. Series 1 – counts of the nucleoplas-min present in the oocyte cytoplasm. Series 2 – counts for the nucleoplasmin in the NRNs and NPCs. Series 3 - counts of the core Np present in the oocyte cytoplasm as the control. Series 4 - counts of the core Np present in the NRNs and NPCs as the control. The concentrations of the Np in the cytoplasm were falling after microinjections, but almost did not change in the absence of the NLS. The concentrations of the Np in the NRN and NPCs gradually increased with the increased passage, but were entirely absent for the core Np.

Similar articles

Cited by

References

    1. Jamali T, Jamali Y, Mehrbod M, Mofrad MR. Nuclear pore complex: biochemistry and biophysics of nucleocytoplasmic transport in health and disease. Int Rev Cell Mol Biol. 2011;287:233–286. - PubMed
    1. Chatel G, Desai SH, Mattheyses AL, Powers MA, Fahrenkrog B. Domain topology of nucleoporin Nup98 within the nuclear pore complex. J Struct Biol. 2012;177:81–89. - PMC - PubMed
    1. Löschberger A, van de Linde S, Dabauvalle MC, Rieger B, Heilemann M, et al. Super-resolution imaging visualizes the eightfold symmetry of gp210 proteins around the nuclear pore complex and resolves the central channel with nanometer resolution. J Cell Sci. 2012;125:570–575. - PubMed
    1. Major AT, Whiley PA, Loveland KL. Expression of nucleocytoplasmic transport machinery: clues to regulation of spermatogenic development. Biochim Biophys Acta. 2011;1813:1668–1688. - PubMed
    1. Funasaka T, Wong RW. The role of nuclear pore complex in tumor microenvironment and metastasis. Cancer Metastasis Rev. 2011;30:239–251. - PubMed

LinkOut - more resources