

Low frequency oscillations in cephalic vessels assessed by near infrared spectroscopy
- PMID: 22897146
- PMCID: PMC3730271
- DOI: 10.1111/j.1365-2362.2012.02704.x
Low frequency oscillations in cephalic vessels assessed by near infrared spectroscopy
Abstract
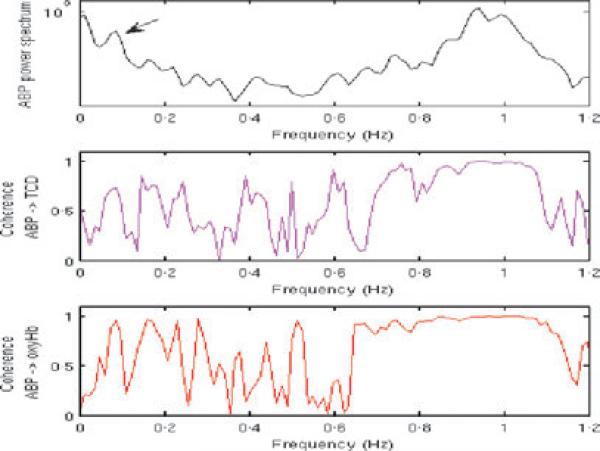
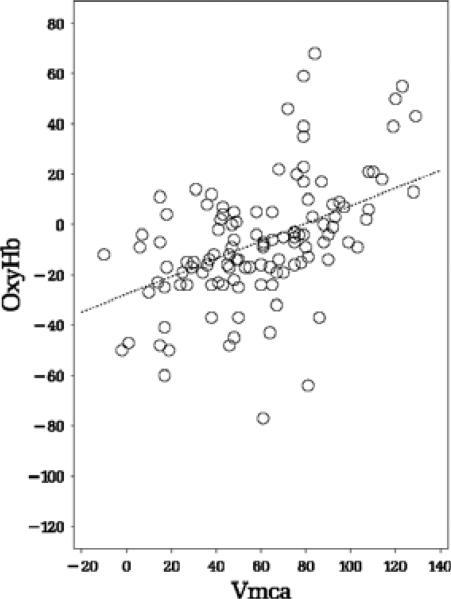
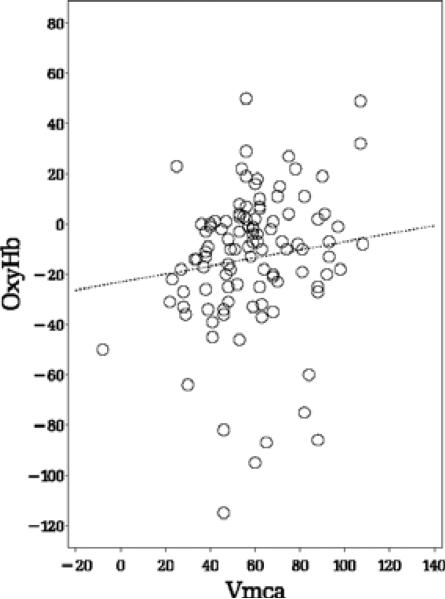
Background and methods: Low frequency oscillations (LFO) of cerebral vessels are believed to reflect cerebral autoregulation. We investigated day-to-day and hemispheric variations in 0.1 Hz LFO with near infrared spectroscopy (NIRS) and transcranial Doppler (TCD) to determine phase shift and gain of oxygenated haemoglobin (oxyHb) and the velocity of the middle cerebral artery (Vmca) to the arterial blood pressure (ABP). The direct left-right phase shifts of oxyHb and Vmca were also assessed. We examined 44 healthy volunteers by simultaneous recordings of ABP, oxyHb and Vmca during spontaneous and paced breathing at 6 breaths per minute on two separate days.
Results: The variation between hemispheres had a prediction interval (PI) of ± 39° for ABP-oxyHb phase shift and ± 69% for gain. ABP-Vmca showed ± 57° PI phase shift and ± 158% PI for gain. The variation from day to day showed ± 61° PI for ABP-oxyHb phase shift and ± 297% PI for gain. ABP-Vmca showed ± 45° PI phase shift and ± 166% PI for gain. We found a linear relation between phase shift of oxyHb and Vmca at paced breathing (P=0.0005), but not at rest (P=0.235).
Conclusion: Our results show that LFO phase shift ABP-oxyHb may be used as a robust measurement of differences in autoregulation between hemispheres and over time. In addition, we found a strong relation between oxyHb and Vmca during paced breathing. Gain showed too large variation for clinical use, as the SD was up to 100-fold of mean values.
© 2012 The Authors. European Journal of Clinical Investigation © 2012 Stichting European Society for Clinical Investigation Journal Foundation.
Figures
Similar articles
-
Dynamic cerebral autoregulation estimates derived from near infrared spectroscopy and transcranial Doppler are similar after correction for transit time and blood flow and blood volume oscillations.J Cereb Blood Flow Metab. 2020 Jan;40(1):135-149. doi: 10.1177/0271678X18806107. Epub 2018 Oct 24. J Cereb Blood Flow Metab. 2020. PMID: 30353763 Free PMC article.
-
Validation of a stand-alone near-infrared spectroscopy system for monitoring cerebral autoregulation during cardiac surgery.Anesth Analg. 2013 Jan;116(1):198-204. doi: 10.1213/ANE.0b013e318271fb10. Epub 2012 Dec 7. Anesth Analg. 2013. PMID: 23223100 Free PMC article.
-
Near-infrared spectroscopy and transcranial sonography to evaluate cerebral autoregulation in middle cerebral artery steno-occlusive disease.J Neurol. 2016 Nov;263(11):2296-2301. doi: 10.1007/s00415-016-8262-5. Epub 2016 Aug 20. J Neurol. 2016. PMID: 27544503
-
Cerebral blood flow response to cardiorespiratory oscillations in healthy humans.Auton Neurosci. 2023 Mar;245:103069. doi: 10.1016/j.autneu.2022.103069. Epub 2022 Dec 23. Auton Neurosci. 2023. PMID: 36584666 Review.
-
Assessing low-frequency oscillations in cerebrovascular diseases and related conditions with near-infrared spectroscopy: a plausible method for evaluating cerebral autoregulation?Neurophotonics. 2018 Jul;5(3):030901. doi: 10.1117/1.NPh.5.3.030901. Epub 2018 Sep 18. Neurophotonics. 2018. PMID: 30689678 Free PMC article. Review.
Cited by
-
Cerebral Microcirculatory Blood Flow Dynamics During Rest and a Continuous Motor Task.Front Physiol. 2019 Oct 24;10:1355. doi: 10.3389/fphys.2019.01355. eCollection 2019. Front Physiol. 2019. PMID: 31708802 Free PMC article.
-
Assessment of the Brain's Macro- and Micro-Circulatory Blood Flow Responses to CO2 via Transfer Function Analysis.Front Physiol. 2016 May 9;7:162. doi: 10.3389/fphys.2016.00162. eCollection 2016. Front Physiol. 2016. PMID: 27242536 Free PMC article.
-
Dynamic cerebral autoregulation estimates derived from near infrared spectroscopy and transcranial Doppler are similar after correction for transit time and blood flow and blood volume oscillations.J Cereb Blood Flow Metab. 2020 Jan;40(1):135-149. doi: 10.1177/0271678X18806107. Epub 2018 Oct 24. J Cereb Blood Flow Metab. 2020. PMID: 30353763 Free PMC article.
-
Bifurcation in Blood Oscillatory Rhythms for Patients with Ischemic Stroke: A Small Scale Clinical Trial using Laser Doppler Flowmetry and Computational Modeling of Vasomotion.Front Physiol. 2017 Mar 23;8:160. doi: 10.3389/fphys.2017.00160. eCollection 2017. Front Physiol. 2017. PMID: 28386231 Free PMC article.
-
Effect of motion artifacts and their correction on near-infrared spectroscopy oscillation data: a study in healthy subjects and stroke patients.J Biomed Opt. 2015 May;20(5):56011. doi: 10.1117/1.JBO.20.5.056011. J Biomed Opt. 2015. PMID: 26018790 Free PMC article.
References
-
- Boas DA, Dale AM, Franceschini MA. Diffuse optical imaging of brain activation: approaches to optimizing image sensitivity, resolution, and accuracy. Neuroimage. 2004;23(Suppl 1):S275–88. - PubMed
-
- Obrig H, Neufang M, Wenzel R, Kohl M, Steinbrink J, Einhaupl K, et al. Spontaneous low frequency oscillations of cerebral hemodynamics and metabolism in human adults. Neuroimage. 2000;12:623–39. - PubMed
-
- Reinhard M, Wehrle-Wieland E, Grabiak D, Roth M, Guschlbauer B, Timmer J, et al. Oscillatory cerebral hemodynamics–the macro- vs. microvascular level. J Neurol Sci. 2006;250:103–9. - PubMed
-
- Reinhard M, Wihler C, Roth M, Harloff A, Niesen WD, Timmer J, et al. Cerebral autoregulation dynamics in acute ischemic stroke after rtPA thrombolysis. Cerebrovasc Dis. 2008;26:147–55. - PubMed
Publication types
MeSH terms
Substances
Grants and funding
LinkOut - more resources
Full Text Sources
Other Literature Sources
Research Materials
Miscellaneous
