. 2012 Oct 23;6(10):8847-56.
doi: 10.1021/nn3027408. Epub 2012 Aug 21.

Electrically induced conformational change of peptides on metallic nanosurfaces

Affiliations

Electrically induced conformational change of peptides on metallic nanosurfaces

Yi Chen et al. ACS Nano. .

Abstract

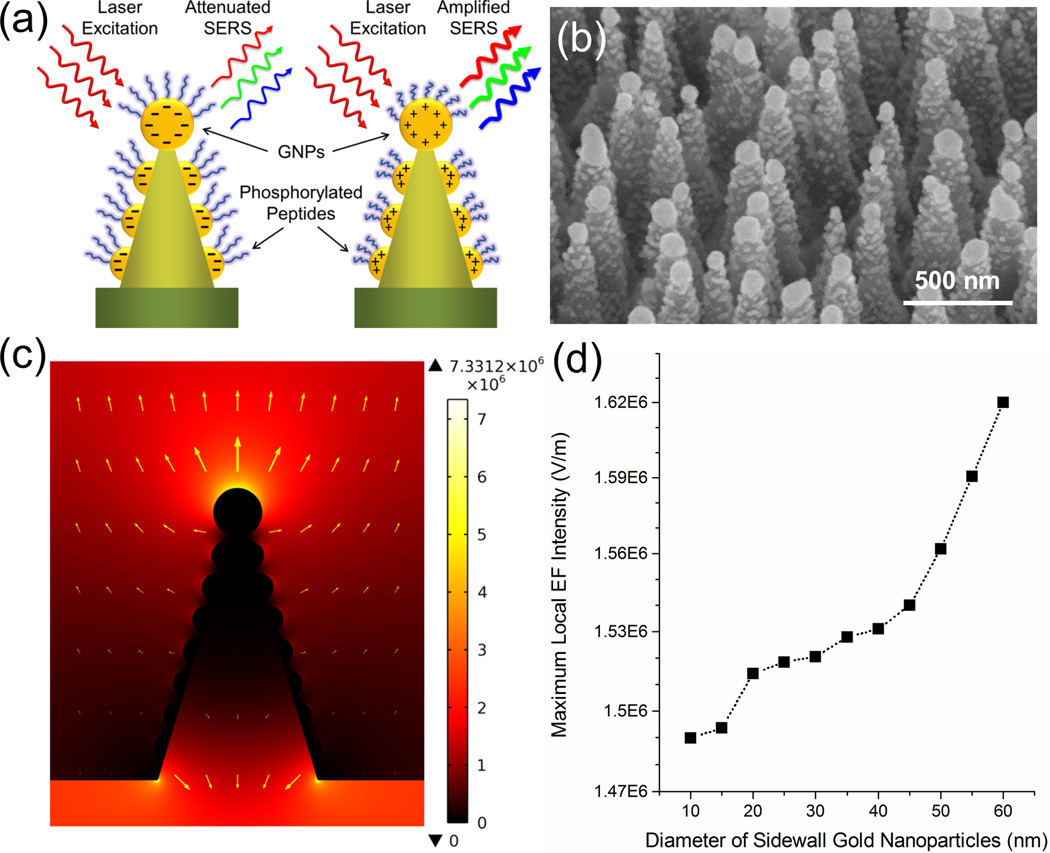
Surface immobilized biomolecular probes are used in many areas of biomedical research, such as genomics, proteomics, immunology, and pathology. Although the structural conformations of small DNA and peptide molecules in free solution are well studied both theoretically and experimentally, the conformation of small biomolecules bound on surfaces, especially under the influence of external electric fields, is poorly understood. Using a combination of molecular dynamics simulation and surface-enhanced Raman spectroscopy, we study the external electric field-induced conformational change of dodecapeptide probes tethered to a nanostructured metallic surface. Surface-tethered peptides with and without phosphorylated tyrosine residues are compared to show that peptide conformational change under electric field is sensitive to biochemical modification. Our study proposes a highly sensitive in vitro nanoscale electro-optical detection and manipulation method for biomolecule conformation and charge at bio-nano interfaces.


Figures

Figure 1
Figure 1. Electrical control of molecular conformations through a charged metal surface
(a) Highlighted in the front is an atomic model of the peptide-rho system tethered to the gold surface colored in yellow. This surface is assumed to be planar at the 10.2 nm × 10.2 nm scale simulated. Other peptide probes are colored in green. The front peptide is highlighted in licorice representation; carbon atoms are colored in light blue, nitrogen atoms dark blue, oxygen atoms red and phosphate atoms yellow; for the sake of clarity hydrogen atoms are not shown; blue and red arrows point to the rho cap and the phosphorylated tyrosine residue, respectively. (b) Kinases or phosphatases add or remove a phosphate group to (on) the peptide probes, and thus modify the net charge of the probes. The peptide is represented as a green line, the phosphate group as a red dot, and the rho fluorescence probe as a blue star. (c) Non-phosphorylated peptides are nearly neutral and unaffected by charges on the metal surface. (d) Phosphorylation introduces a net charge of −2e to the peptides, which leads to bending of the peptides under positive surface charge polarity.
Figure 2
Figure 2. Topology of experimental nanodevice
(a) Schematic drawing of GNP-coated nanocones and surface-tethered peptides. GNP are colored in yellow, peptides in blue. SERS signals are attenuated or amplified when peptides stretch or coil under different surface charge polarities. (b) Scanning electron microscope image showing silicon nanocone array with uniformly coated GNP at the tips and sidewalls. (c) Calculated enhancement of electrostatic field near a GNP-coated silicon nanocone surface. The GNPs on top and sidewall of the nanocone are 90 nm and 50 nm in diameter, respectively. The top electrode is 1.5 µm away from the bottom surface. The electric field near the GNP surface reveals a high field gradient near the tethered peptides. The maximum field strength is 7.33 × 10⁶ V m−1 and arises near the top of the nanocones. The yellow arrows represent the electric field directions and strength. (d) The dependence of the maximum local electrical field intensity near the sidewall GNP surface to the diameter of GNPs. The results show stronger localized electrical field for larger GNPs.
Figure 3
Figure 3. SERS sensitivity for phosphorylation detection
(a) Representative SERS spectra of serially diluted rho solutions spotting on the substrate surface. Concentrations from 100 µM down to 1 pM were faithfully detected, displaying a sensitivity down to 1 part-per-billion. (b) Comparison of SERS spectra for rho, rho-labeled non-phosphorylated and rho-labeled phosphorylated peptide sequences, all in aqueous solution. SERS peaks are labeled by corresponding wave numbers; the latter are assigned to specific vibrations in Table S1 in Supporting Information. The spectra are equally offset in the plot in order to display all spectra clearly.
Figure 4
Figure 4. SERS spectra and statistical analysis of peptide probes for different voltages
(a–b) Averaged raw SERS spectra and standard deviation (area plot below each spectrum) of non-phosphorylated (a) and phosphorylated (b) peptide probes under 0, ±1.2 V bias. The spectra are equally offset in the plot in order to display all spectra clearly. (c–d) Color-coded mean SERS spectra of non-phosphorylated (c) and phosphorylated (d) peptides probes under 0, ±1.2 V bias (top three lanes) along with the Log2-fold variations of SERS spectra intensity with and without applied electric field (bottom two lanes). In (a) and (b), Raman shift is represented linearly in the range 500 to 1700 cm−1. Raman signal intensity and Log2-fold variations are represented by a color scale ranging from green to red (0 – 150 (c) and 0 – 385 (d)) and from blue to red (−1.0 – +1.0 (c) and −1.5 – +1.5 (d)), respectively, as shown by color bars (in units of standard deviation shown in a,b).
Figure 5
Figure 5. Bending and stretching of phosphorylated peptides revealed by MD simulations
(a–d) show the average tyrosine-gold distance of 25 peptides tethered to a planar gold surface. Error bars represent ± standard deviation. Non-phosphorylated peptide sensor under 0, ±6 V bias (a), and under 0, ±60 V bias (c). Phosphorylated peptide sensor under 0, ±6 V bias (b), and under 0, ±60 V bias (d). Panels (i) and (ii) show snapshots of peptide conformations after 5 ns for −60 V (i) and +60 V (ii) biases. The peptides are clored in gray, and tyrosine residues in red. Rhodamine residues are not shown. The 25 peptides were aligned using the attaching gold atom, shown in yellow. Grid spacing is 1 nm.
Figure 6
Figure 6. Characteristics of initial and optimized sequences revealed by MD simulations
(a) Shown is the aggregation of three rho residues of non-phosphorylated peptides at 0 V. Aggregation of rho was observed in all MD simulations of the initial sequence. (b–c) Shown is the orientation of lysine residues of a non-phosphorylated peptide under +60 V and −60 V biases, respectively. Positively-charged lysine residues respond to the external electric field; blue arrows highlight lysine direction. Positively-charged residues are colored in blue, tyrosine in green, and negatively-charged residues in red. (d–e) Shown is the response of the proposed new sequence (EGIYGVLAAAAC) to 0, ±60 V. The non-phosphorylated new sequence is insensitive to an electric field (d) and, when phosphorylated, is highly responsive to an external electric field (e). Error bars represent ± standard deviation.

Similar articles

Cited by

References

    1. Huang Z, Boulatov R. Chemomechanics: Chemical Kinetics for Multiscale Phenomena. Chem. Soc. Rev. 2011;40:2359–2384. - PubMed
    1. Tashiro R, Sugiyama H. Biomolecule-Based Switching Devices That Respond Inversely to Thermal Stimuli. J. Am. Chem. Soc. 2005;127:2094–2097. - PubMed
    1. Saha S, Stoddart JF. Photo-Driven Molecular Devices. Chem. Soc. Rev. 2007;36:77–92. - PubMed
    1. Heath JR. Molecular Electronics. Annu. Rev. Mater. Res. 2009;39:1–23.
    1. Ariga K, Mori T, Hill JP. Control of Nano/Molecular Systems by Application of Macroscopic Mechanical Stimuli. Chem. Sci. 2011;2:195–203.

Publication types

MeSH terms