

Are the 1976-1985 birth cohorts heavier drinkers? Age-period-cohort analyses of the National Alcohol Surveys 1979-2010
- PMID: 22897662
- PMCID: PMC3547140
- DOI: 10.1111/j.1360-0443.2012.04055.x
Are the 1976-1985 birth cohorts heavier drinkers? Age-period-cohort analyses of the National Alcohol Surveys 1979-2010
Abstract
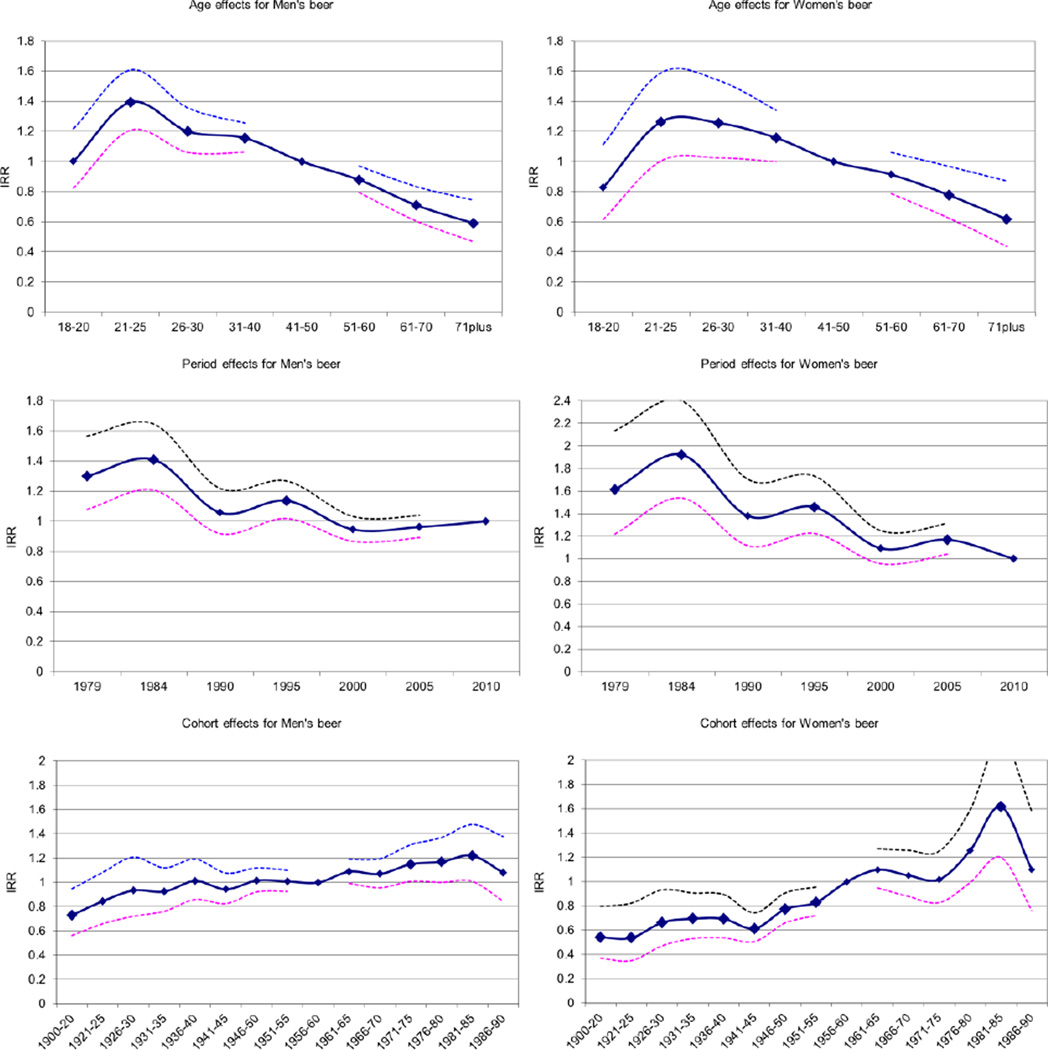
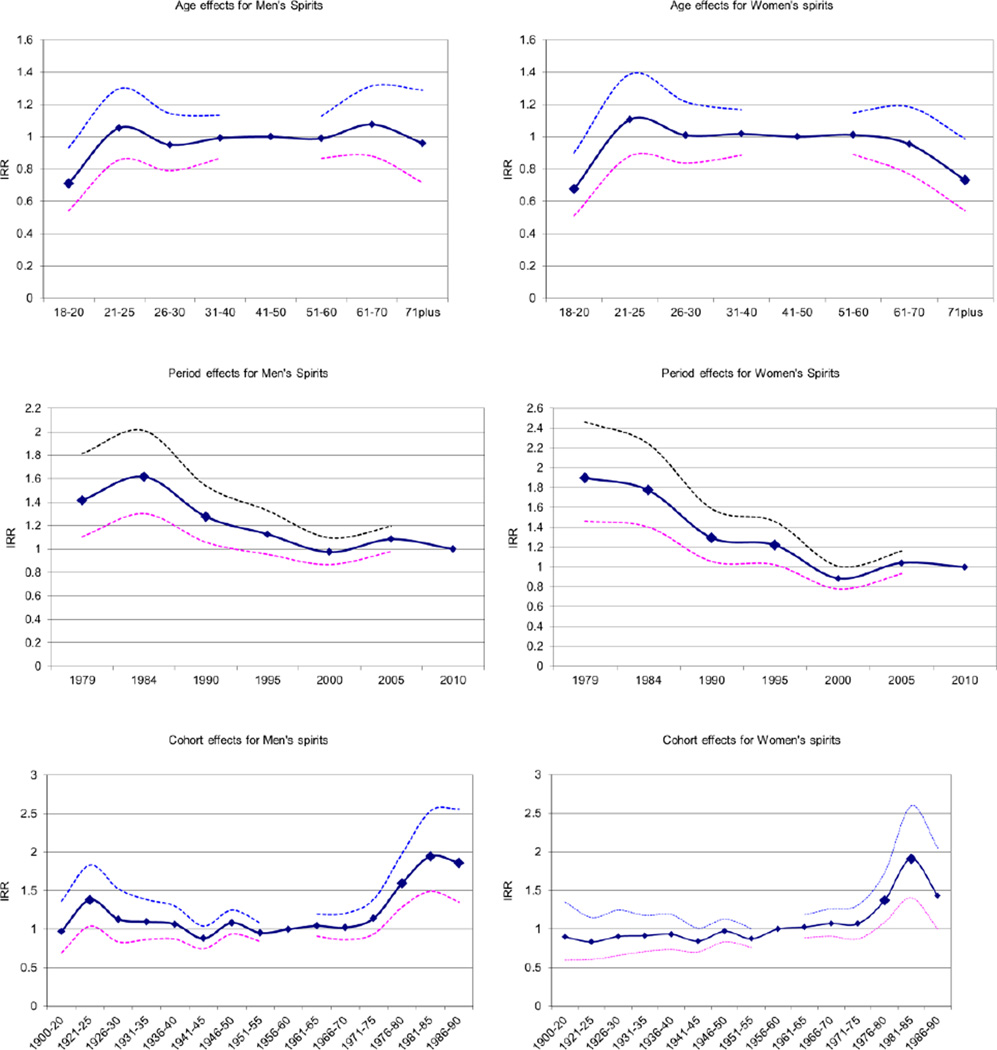
Aims: To estimate age-period-cohort models predicting alcohol volume, heavy drinking and beverage-specific alcohol volume in order to evaluate whether the 1976-1985 birth cohorts drink relatively heavily.
Design: Data from seven cross-sectional surveys of the USA conducted between 1979 and 2010 were utilized in negative binomial generalized linear models of age, period and cohort effects predicting alcohol measures.
Setting: General population surveys of the USA.
Participants: Thirty-six thousand four hundred and thirty-two US adults (aged 18 years or older).
Measurements: Monthly number of alcohol drinks, beer, wine and spirits drinks, and days drinking five or more drinks in the past year derived from beverage-specific graduated frequency questions.
Findings: Relative to the reference 1956-60 birth cohort, men in the 1976-1980 cohort for were found to consume more alcohol [incidence rate ratio (IRR) = 1.222: confidence interval (CI) 1.07-1.39) and to have more 5+ days (the number of days having five or more drinks) (IRR = 1.365: CI 1.09-1.71) as were men in the 1980-85 cohort for volume (IRR = 1.284: CI 1.10-1.50) and 5+ days (IRR = 1.437: CI 1.09-1.89). For women, those in the 1980-85 cohort were found to have higher alcohol volume (IRR = 1.299: CI 1.07-1.58) and more 5+ days (IRR = 1.547: CI 1.01-2.36). Beverage-specific models found different age patterns of volume by beverage with a flat age pattern for both genders' spirits and women's wine, an increasing age pattern for men's wine and a declining age pattern from those in their early 20s for beer.
Conclusions: In the USA, men born between 1976 and 1985, and women born between 1981 and 1985 have higher alcohol consumption than in earlier or later years.
© 2012 The Authors, Addiction © 2012 Society for the Study of Addiction.
Figures

Comment in
-
Commentary on Kerr et al. (2013): The 'French Paradox' versus binge drinking.Addiction. 2013 Jun;108(6):1049-50. doi: 10.1111/add.12211. Addiction. 2013. PMID: 23659843 No abstract available.
References
-
- LaVallee RA, Yi H-y. Bethesda, MD: U.S. Department of Health and Human Services, Public Health Service, National Institutes of Health; 2010. Aug, [Accessed: 2011-09-1 3]. Apparent per capita alcohol alcohol consumption: national, state, and regional trends, 1977–2008. (Surveillance Report #90) Archived by WebCite® at http://www.webcitation.org/61fqKpdoo.
-
- Kerr WC, Greenfield TK, Bond J, Ye Y, Rehm J. Age, period and cohort influences on beer, wine and spirits consumption trends in the US National Surveys. Addiction. 2004 Sep;99(9):1111–1120. - PubMed
-
- Kerr WC, Greenfield TK, Bond J, Ye Y, Rehm J. Age-period-cohort influences on trends in past year marijuana use in the U.S. from the 1984, 1990, 1995, and 2000 National Alcohol Surveys. Drug Alcohol Depend. 2007 Jan;86(2–3):132–138. - PubMed
Publication types
MeSH terms
Grants and funding
LinkOut - more resources
Full Text Sources
Medical
Miscellaneous
