. 2012 Sep 18;84(18):7954-62.
doi: 10.1021/ac301723s. Epub 2012 Aug 28.

Microfluidic, label-free enrichment of prostate cancer cells in blood based on acoustophoresis

Affiliations

Microfluidic, label-free enrichment of prostate cancer cells in blood based on acoustophoresis

Per Augustsson et al. Anal Chem. .

Abstract

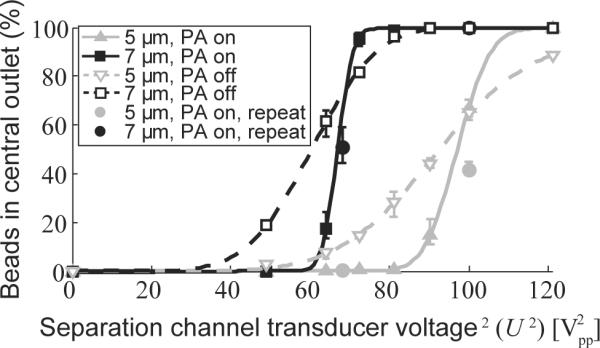
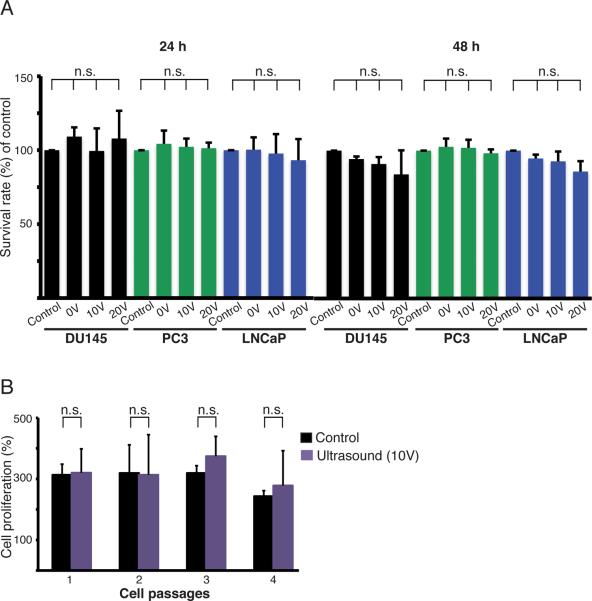
Circulating tumor cells (CTC) are shed in peripheral blood at advanced metastatic stages of solid cancers. Surface-marker-based detection of CTC predicts recurrence and survival in colorectal, breast, and prostate cancer. However, scarcity and variation in size, morphology, expression profile, and antigen exposure impairs reliable detection and characterization of CTC. We have developed a noncontact, label-free microfluidic acoustophoresis method to separate prostate cancer cells from white blood cells (WBC) through forces generated by ultrasonic resonances in microfluidic channels. Implementation of cell prealignment in a temperature-stabilized (±0.5 °C) acoustophoresis microchannel dramatically enhanced the discriminatory capacity and enabled the separation of 5 μm microspheres from 7 μm microspheres with 99% purity. Next, we determined the feasibility of employing label-free microfluidic acoustophoresis to discriminate and divert tumor cells from WBCs using erythrocyte-lysed blood from healthy volunteers spiked with tumor cells from three prostate cancer cell-lines (DU145, PC3, LNCaP). For cells fixed with paraformaldehyde, cancer cell recovery ranged from 93.6% to 97.9% with purity ranging from 97.4% to 98.4%. There was no detectable loss of cell viability or cell proliferation subsequent to the exposure of viable tumor cells to acoustophoresis. For nonfixed, viable cells, tumor cell recovery ranged from 72.5% to 93.9% with purity ranging from 79.6% to 99.7%. These data contribute proof-in-principle that label-free microfluidic acoustophoresis can be used to enrich both viable and fixed cancer cells from WBCs with very high recovery and purity.


Figures

Figure 1
Figure 1
Overview of the acoustophoresis microfluidic chip and system. (A) Top view schematic. A suspension of cells/particles enters the system through the inlet (1), after which cells are pre-aligned in an acoustophoresis channel (2) by means of an acoustic field (a-a') in the yz-plane. The two bands of cells are bifurcated (3) to two sides of a central inlet fluid flow (4) and the pre-aligned cells are thereafter flow laminated to proximity of the walls of a separation channel (5), where the trajectories of individual cells are deflected in an acoustic field (b-b') according to their intrinsic acoustic properties and morphology. At the trifurcation outlet (6), a subgroup of cells can be selectively guided to the central outlet of the chip (7) by tuning the intensity of the second acoustic field while cells of low acoustophoretic mobility will be guided to the side outlet (8). Insets show pre-aligned (T1 on) and non-pre-aligned (T1 off) microbeads at the end of the pre-alignment channel, and 5 and 7 μm beads separated at the central outlet (T1 and T2 on). (B) Side view schematic. Cells/particles are pre aligned in the vertical direction by means of an acoustic force (c-c') to minimize the influence of the parabolic flow profile (d-d') in the channel, which may otherwise affect the trajectories of the cells. (C) A photo showing the positions of the piezoceramic transducers (9 and 10), the Peltier element that regulates the temperature (11), and the temperature sensor (12). Scale bar = 10 mm. (D) A schematic of the flow configuration for the acoustophoresis cell separation experiments. Syringe pumps drive the flow in the outlets and in the central fluid inlet. Cell suspension is drawn from the bottom of a test tube (13) by suction. The outlets are sampled via two sample loops (14), each of volume 100 μL.
Figure 2
Figure 2
Acoustophoretic separation of microbeads. Graph showing the proportion of 5 μm beads (gray) and 7 μm beads (black) collected in the central outlet, compared to the total number of beads collected, as a function of U2, the piezoceramic transducer voltage squared. (U2 is linearly proportional to the acoustic energy density and thus also the acoustic velocity of the beads.) Experiments were performed with acoustophoresis pre-alignment (PA) on (filled symbols) or off (open symbols). Measurements were repeated at two of the voltages on a later occasion (filled circles). The lines represent fits of a cumulative distribution function to the experimental data (see Supplementary Note 1). The values given are means, the error bars denoting min and max values (n=3).
Figure 3
Figure 3
Tumor cell enrichment using acoustophoretic pre-alignment of cells. RBC lysed blood spiked with prostate cancer cells were processed in the chip. The central outlet cell recovery, i.e. the proportion of cells collected from the central outlet (compared to the total amount of cells collected), was measured by flow cytometry. (A) The effects of cell pre alignment (PA) on PFA fixed DU145 cells (black), and WBCs (red). Acoustic pre alignment; on (solid lines) and off (dashed lines). (B) Separation of three different PFA-fixed prostate cancer cell lines (DU145, PC3, and LNCaP) from blood cells by acoustophoresis with pre-alignment. (C) Acoustic separation of DU145 cells (250,000 / mL) spiked in different concentrations of WBC at an energy level of 120 Vpp2, with active cell PA. (D) Separation of live DU145 cells from blood cells using acoustophoresis with PA. The values given are means, the error bars denoting min and max values.
Figure 4
Figure 4
Effects on cancer cell viability and proliferation. (A) Cell viability was determined by measuring the mitochondrial dehydrogenase activity in three prostate cancer cell lines: DU145, PC3, and LNCaP, 24 h and 48 h after acoustophoresis using transducer voltages of 0, 10, and 20 V. Untreated cells were used as controls and their survival rate was set to 100%. The graphs show the results from at least three separate experiments and the values given are the mean ± SD (n=4). (B) The proliferation of DU145 cells was monitored after acoustophoresis and compared to that of untreated cells. The cells were cultured for four passages of 60 h each. The number of cells at 0 h for each passage was set to 100%. The values given are the mean ± SD (n=4), and n.s. denotes non significant differences.

Similar articles

Cited by

References

    1. Society AC. In: Cancer Facts & Figures 2011. Society AC, editor. Atlanta: 2011.
    1. Comen E, Norton L, Massague J. Nat Rev Clin Oncol. 2011;8:369–377. - PubMed
    1. Nauseef JT, Henry MD. Nat Rev Urol. 2011;8:428–439. - PMC - PubMed
    1. Mostert B, Sleijfer S, Foekens JA, Gratama JW. Cancer Treat Rev. 2009;35:463–474. - PubMed
    1. Danila DC, Heller G, Gignac GA, Gonzalez-Espinoza R, Anand A, Tanaka E, Lilja H, Schwartz L, Larson S, Fleisher M, Scher HI. Clin Cancer Res. 2007;13:7053–7058. - PubMed

Publication types

Substances