Vascular degeneration in Parkinson's disease
- PMID: 22897695
- PMCID: PMC8029297
- DOI: 10.1111/j.1750-3639.2012.00628.x
Vascular degeneration in Parkinson's disease
Abstract
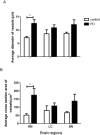
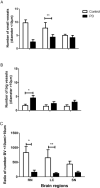
Vascular degeneration plays a significant role in contributing to neurodegenerative conditions such as Alzheimer's disease. Our understanding of the vascular components in Parkinson's disease (PD) is however limited. We have examined the vascular morphology of human brain tissue from both PD and the control cases using immunohistochemical staining and image analysis. The degenerative morphology seen in PD cases included the formation of endothelial cell "clusters," which may be contributed by the fragmentation of capillaries. When compared to the control cases, the capillaries of PDs were less in number (P < 0.001), shorter in length (P < 0.001) and larger in diameter (P < 0.01) with obvious damage to the capillary network evidenced by less branching (P < 0.001). The level of degeneration seen in the caudate nucleus was also seen in the age-matched control cases. Vessel degeneration associated with PD was, however, found in multiple brain regions, but particularly in the substantia nigra, middle frontal cortex and brain stem nuclei. The data suggest that vascular degeneration could be an additional contributing factor to the progression of PD. Thus, treatments that prevent vascular degeneration and improve vascular remodeling may be a novel target for the treatment of PD.
© 2012 The Authors; Brain Pathology © 2012 International Society of Neuropathology.
Figures


Similar articles
-
String Vessel Formation is Increased in the Brain of Parkinson Disease.J Parkinsons Dis. 2015;5(4):821-36. doi: 10.3233/JPD-140454. J Parkinsons Dis. 2015. PMID: 26444086
-
Analysis of gene expression in Parkinson's disease: possible involvement of neurotrophic support and axon guidance in dopaminergic cell death.Brain Pathol. 2009 Jan;19(1):91-107. doi: 10.1111/j.1750-3639.2008.00171.x. Epub 2008 May 7. Brain Pathol. 2009. PMID: 18462474 Free PMC article.
-
Cell death mechanisms in Parkinson's disease.J Neural Transm (Vienna). 2000;107(1):1-29. doi: 10.1007/s007020050001. J Neural Transm (Vienna). 2000. PMID: 10809400
-
Post mortem studies in Parkinson's disease--is it possible to detect brain areas for specific symptoms?J Neural Transm Suppl. 1999;56:1-29. doi: 10.1007/978-3-7091-6360-3_1. J Neural Transm Suppl. 1999. PMID: 10370901 Review.
-
Cellular and molecular mechanisms underlying perturbed energy metabolism and neuronal degeneration in Alzheimer's and Parkinson's diseases.Ann N Y Acad Sci. 1999;893:154-75. doi: 10.1111/j.1749-6632.1999.tb07824.x. Ann N Y Acad Sci. 1999. PMID: 10672236 Review.
Cited by
-
Vascular risk factors, white matter lesions and cognitive impairment in Parkinson's disease: the PACOS longitudinal study.J Neurol. 2021 Feb;268(2):549-558. doi: 10.1007/s00415-020-10189-8. Epub 2020 Aug 31. J Neurol. 2021. PMID: 32865628 Free PMC article.
-
The contribution of inflammatory astrocytes to BBB impairments in a brain-chip model of Parkinson's disease.Nat Commun. 2023 Jun 20;14(1):3651. doi: 10.1038/s41467-023-39038-8. Nat Commun. 2023. PMID: 37339976 Free PMC article.
-
Microbes Tickling Your Tummy: the Importance of the Gut-Brain Axis in Parkinson's Disease.Curr Behav Neurosci Rep. 2017;4(4):361-368. doi: 10.1007/s40473-017-0129-2. Epub 2017 Nov 8. Curr Behav Neurosci Rep. 2017. PMID: 29201595 Free PMC article. Review.
-
Applicability of optical coherence tomography angiography (OCTA) imaging in Parkinson's disease.Sci Rep. 2021 Mar 9;11(1):5520. doi: 10.1038/s41598-021-84862-x. Sci Rep. 2021. PMID: 33750844 Free PMC article.
-
GLP-1 Receptor Agonists in Neurodegeneration: Neurovascular Unit in the Spotlight.Cells. 2022 Jun 25;11(13):2023. doi: 10.3390/cells11132023. Cells. 2022. PMID: 35805109 Free PMC article. Review.
References
-
- Abe Y, Yamamoto T, Soeda T, Kumagai T, Tanno Y, Kubo J et al (2009) Diabetic striatal disease: clinical presentation, neuroimaging, and pathology. Intern Med 48:1135–1141. - PubMed
-
- Arganda‐Carreras I, Fernández‐González R, Muñoz‐Barrutia A, Ortiz‐De‐Solorzano C (2010) 3D reconstruction of histological sections: application to mammary gland tissue. Microsc Res Tech 73:1019–1029. - PubMed
-
- Aston‐Jones G, Shipley MT, Chouvet G, van Ennis M, Bockstaele E, Pieribone V et al (1991) Afferent regulation of locus coeruleus neurons: anatomy, physiology and pharmacology. Prog Brain Res 88:47–75. - PubMed
MeSH terms
LinkOut - more resources
Full Text Sources
Medical
Miscellaneous

