. 2012 Aug 14;22(2):167-79.
doi: 10.1016/j.ccr.2012.06.012.

Synergy between PI3K signaling and MYC in Burkitt lymphomagenesis

Affiliations

Synergy between PI3K signaling and MYC in Burkitt lymphomagenesis

Sandrine Sander et al. Cancer Cell. .

Abstract

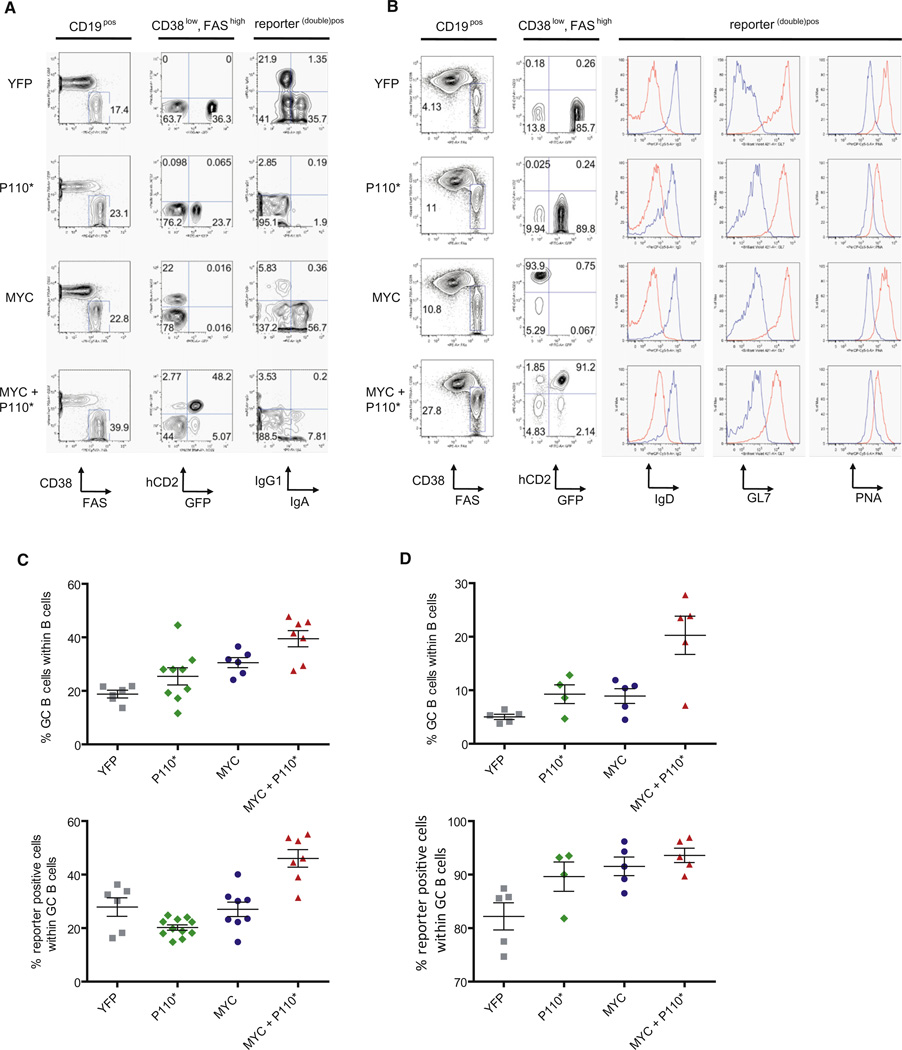
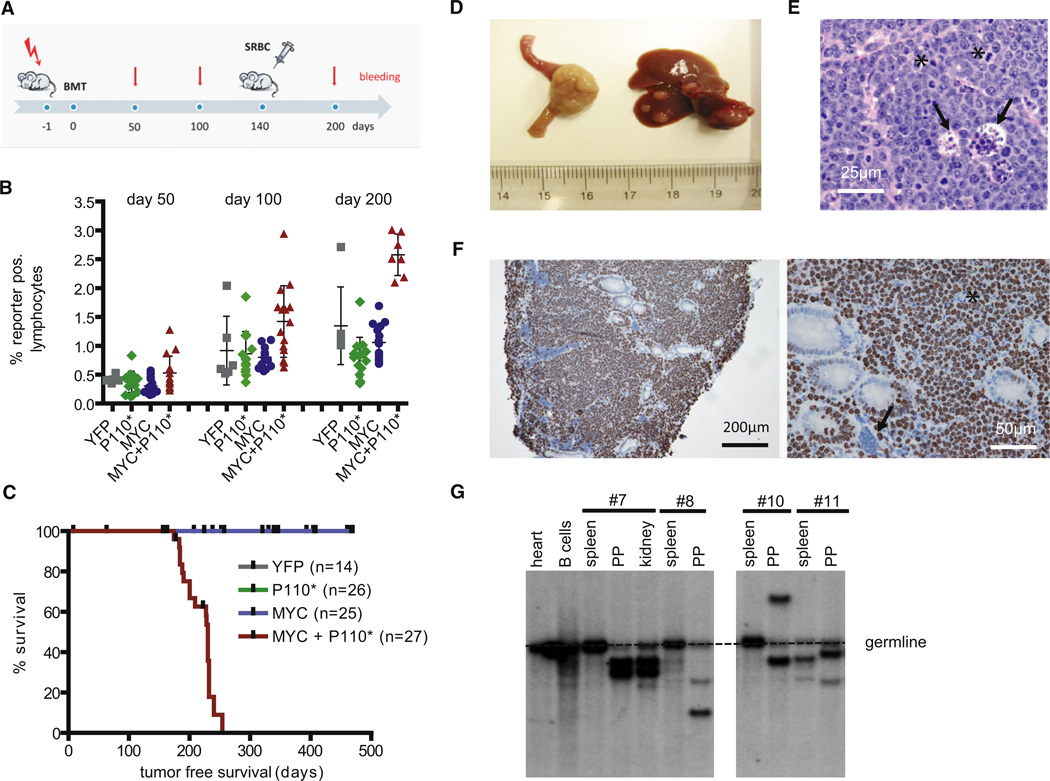
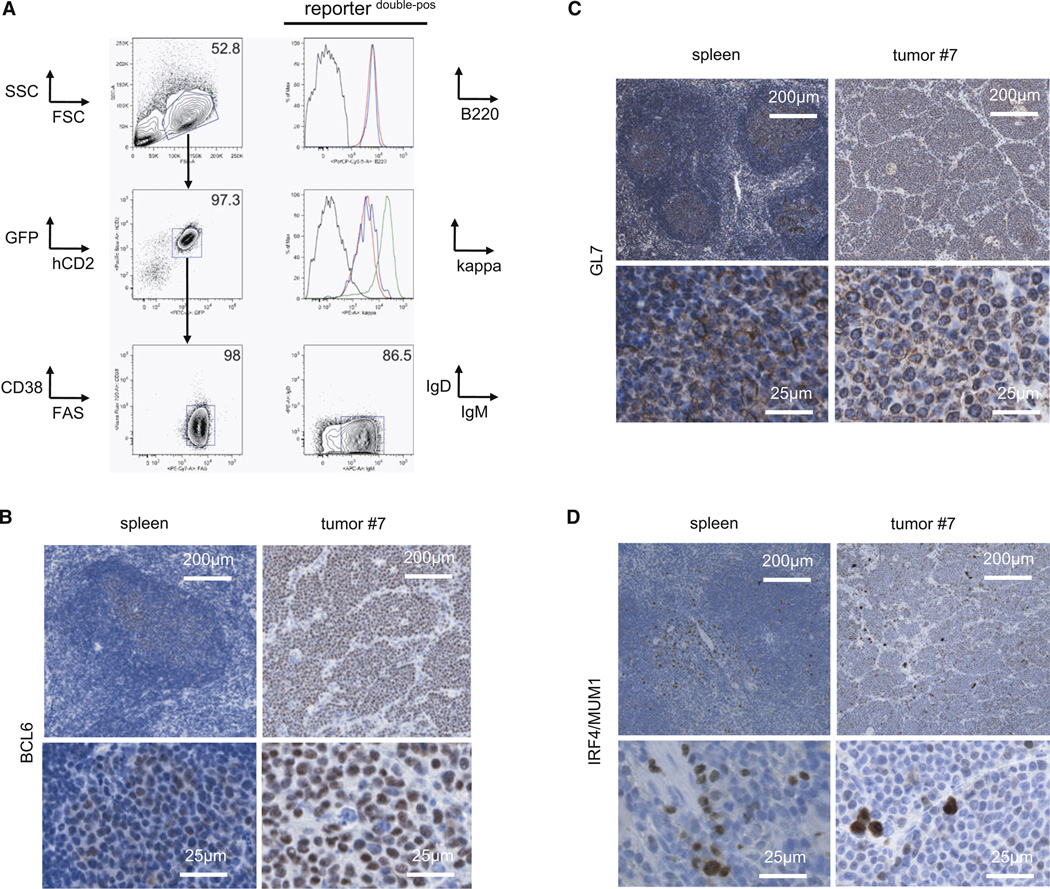
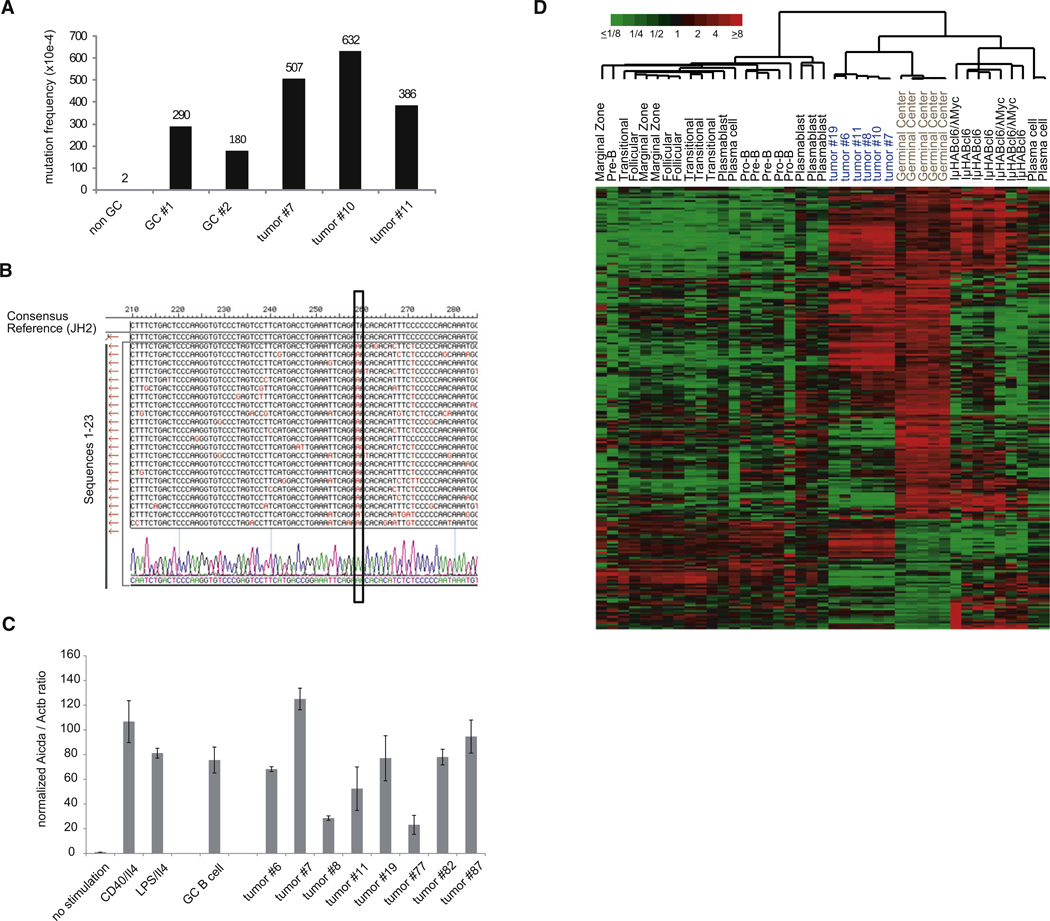
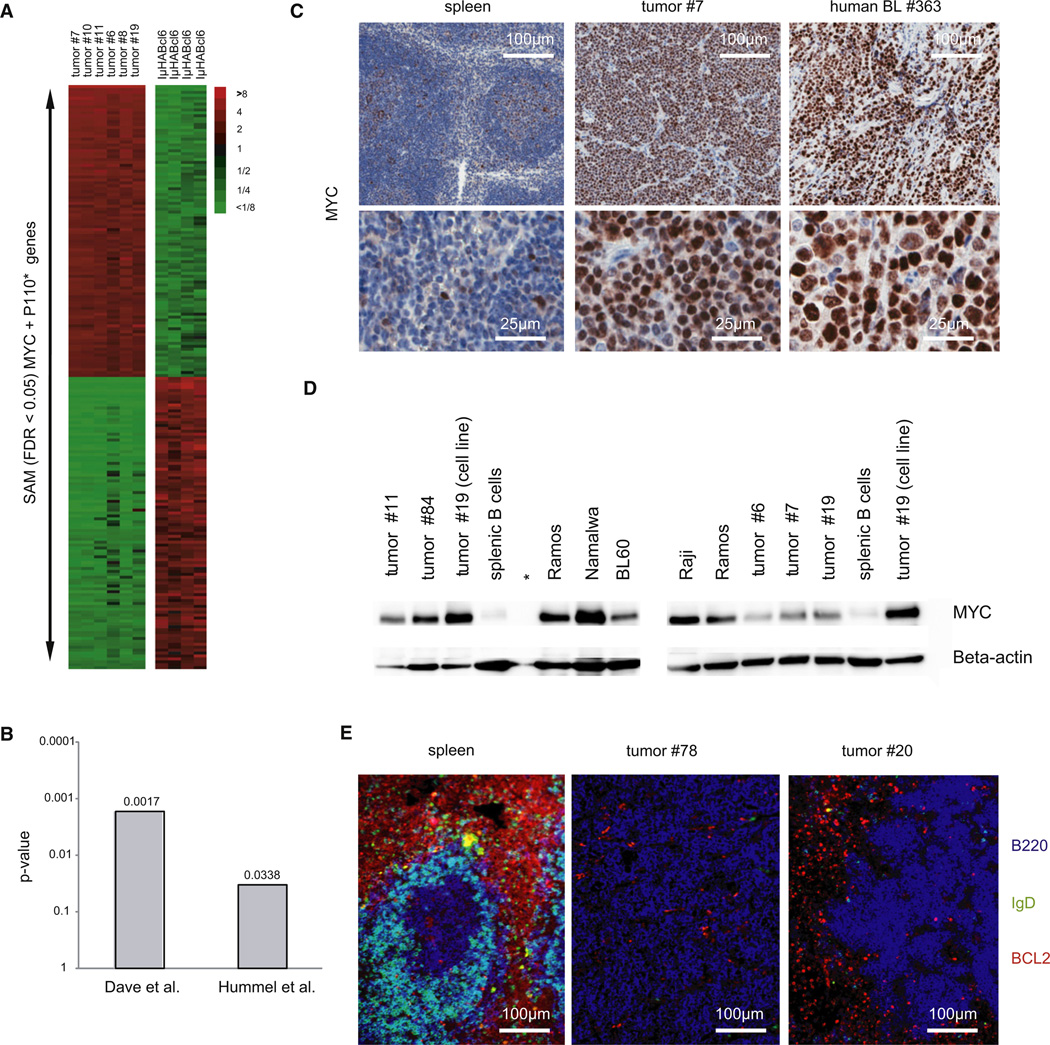
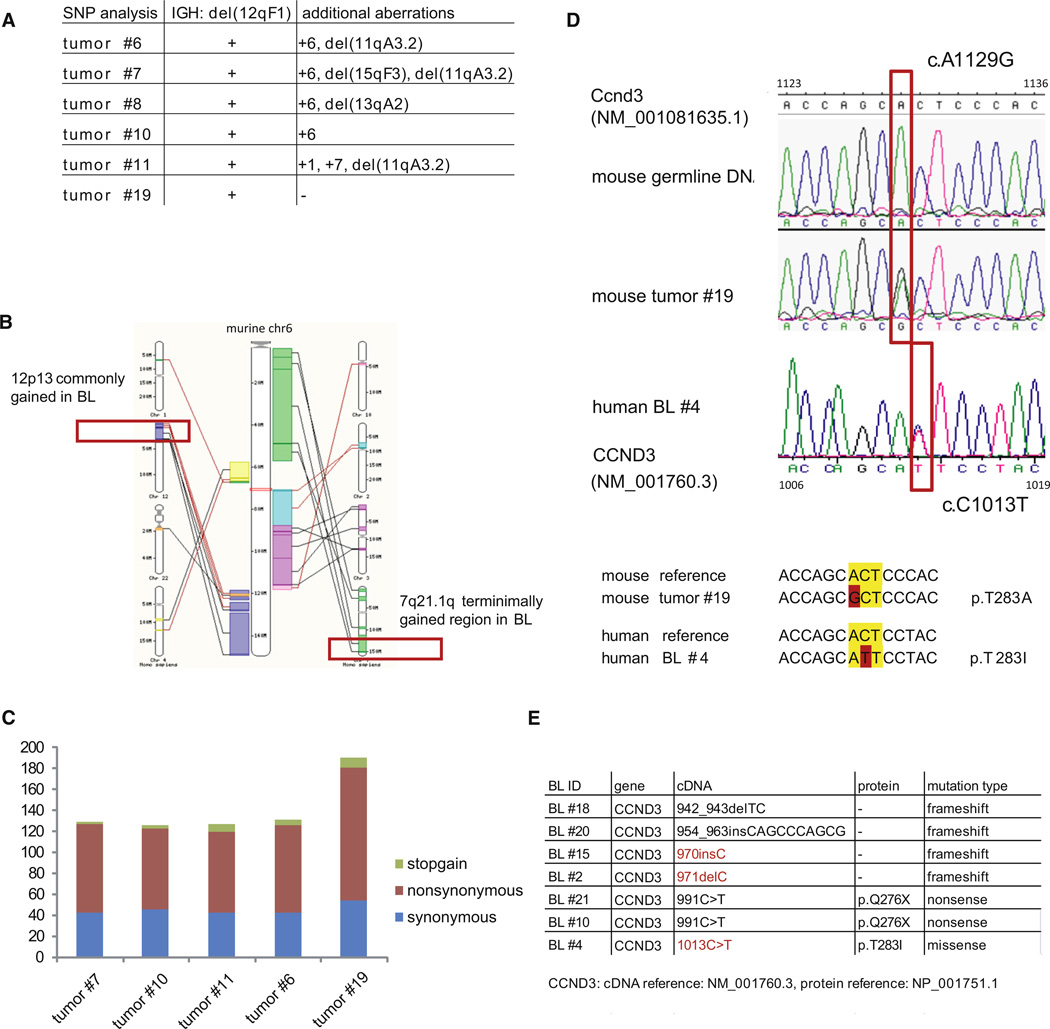
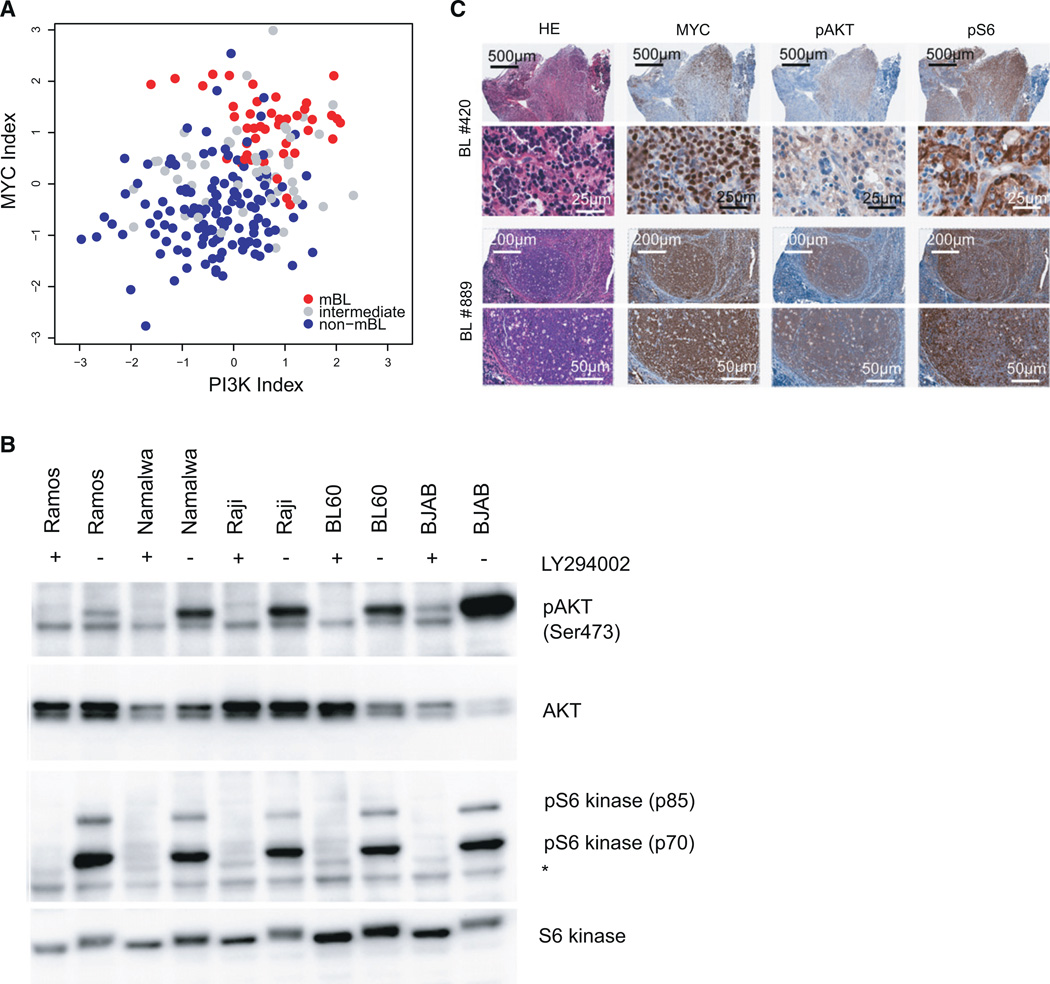
In Burkitt lymphoma (BL), a germinal center B-cell-derived tumor, the pro-apoptotic properties of c-MYC must be counterbalanced. Predicting that survival signals would be delivered by phosphoinositide-3-kinase (PI3K), a major survival determinant in mature B cells, we indeed found that combining constitutive c-MYC expression and PI3K activity in germinal center B cells of the mouse led to BL-like tumors, which fully phenocopy human BL with regard to histology, surface and other markers, and gene expression profile. The tumors also accumulate tertiary mutational events, some of which are recurrent in the human disease. These results and our finding of recurrent PI3K pathway activation in human BL indicate that deregulated c-MYC and PI3K activity cooperate in BL pathogenesis.


Figures

Figure 1
Figure 1. MYC and P110* Co-Expression Results in Increased GC B Cell Formation
(A) Representative FACS analysis of PP isolated from Cγ1-cre, R26StopFLeYFP (YFP); Cγ1-cre, R26StopFLP110*(P110*); Cγ1-cre, R26StopFLMYC (MYC) and Cγ1-cre, R26StopFLMYC, R26StopFLP110* (MYC+P110*) animals. The sequential gating strategy is shown on top of each column. (B) Representative FACS analysis in Rag2cgKO animals reconstituted with BM of the various genotypes and immunized with SRBC 10 days before analysis. The gating was performed according to (A). The histograms show expression of classical GC B cell markers in reporter (double) positive cells (red) and non-GC B cells (blue). (C) Mean percentage (±SEM) of GC B cells (CD38low, FAShigh) and reporter (double) positive cells within PP of mice analyzed according to (A). At least six animals per genotype were analyzed. (D) Mean percentage (±SEM) of GC B cells (CD38low, FAShigh) and reporter (double) positive cells within spleens of mice analyzed according to (B). At least 4 BM reconstituted animals per genotype were analyzed. See also Figure S1.
Figure 2
Figure 2. MYC and PI3K Pathway Activation Cooperate in Tumorigenesis
(A) Experimental protocol. Sublethally irradiated (day −1) Rag2cgKO mice were reconstituted with donor BM (from Cγ1-cre, R26StopFLeYFP; Cγ1-cre, R26StopFLP110*; Cγ1-cre, R26StopFLMYC; or Cγ1-cre, R26StopFLMYC, R26StopFLP110* animals) on day 0. Per genotype three individual BM donors were used. Transgene expression was enforced by a single SRBC immunization at day 140. Blood analyses were performed at days 50, 100, and 200 after BM transfer. (B) Blood analysis of Rag2cgKO animals reconstituted with BM of the indicated genotypes. FACS analyses were performed at days 50, 100, and 200 after BM transfer. Mean percentage (±SEM) of reporter (double) positive lymphocytes is shown. (C) Tumor-free survival of reconstituted Rag2cgKO animals. The total number of BM recipients is shown in parentheses. The ticks indicate non-tumor-related deaths. (D) 12/21 tumors originated from the PP in the small intestine of MYC and P110* co-expressing animals (left). In 17/21 animals tumors disseminated to the liver (right). (E) Representative HE staining in tumor no. 7. The asterisks mark mitotic figures within dividing cells. The arrowheads point to histiocytes clearing apoptotic cells. In total seven tumors were analyzed. (F) Representative immunohistochemical staining for Ki67 in tumor no. 7. Interspersed nonmalignant (arrowhead) and dead cells (asterisk) are Ki67 negative. In total seven tumors were analyzed. (G) Southern blot analysis for IgH gene rearrangements in PP derived tumors and potentially infiltrated organs using a JH4 probe. Monoclonal B cell expansion was seen in the PP, but not in the spleens of diseased animals (with exception of animal no. 11 showing expansion of an additional B cell clone in the spleen). See also Table S1.
Figure 3
Figure 3. Lymphomas Arising upon MYC and PI3K Activation Express GC B-Cell-Specific Markers
(A) Representative FACS analysis of GC B cell markers (B220, CD38, FAS, sIgD) and sIgM expression on tumor cells (defined as GFPpos and hCD2pos cells). The sequential gating strategy is indicated by arrows. Upper histogram: B220 expression on tumor cells (red) and normal splenic B cells (blue) in comparison to non-B cells (black). Lower histogram: Kappa light chain expression on tumor cells (red) and normal GC B cells (blue) in comparison to non-B cells (black) and normal follicular B cells (green). (B–D) Representative immunohistochemical stainings for BCL6 (B), GL7 (C) and IRF4/MUM1 (D) in tumor no. 7 and control spleen (derived from a Cγ1-cre, R26StopFLeYFP animal 10 days after SRBC immunization). Per staining seven tumors were analyzed. See also Figure S2.
Figure 4
Figure 4. MYC and P110* Co-Expressing Tumors Show Ongoing SHM and Express GC B-Cell-Specific Genes
(A) Mutation frequency in rearranged IgH-V region genes of non-GC B cells, GC B cells, and MYC+P110* co-expressing tumors (n = 3). (B) SHM analysis in tumor no. 7. The rearranged IgH-V region genes of individual tumor cells were aligned to the JH2 reference sequence (n = 23). Mutations are labeled in red. The box marks a mutation shared by all sequences of this particular tumor. (C) Aicda expression in stimulated B cells, GC B cells and MYC+P110* co-expressing tumors (n = 8) was analyzed by qRT-PCR. The ratio Aicda/Actb in non-stimulated cells was arbitrary defined as 1 and the values of the other samples were normalized to it. The mean expression from triplicate measurements (±SEM) was used for the calculations. (D) Hierarchical cluster analysis based on relative transcript levels of 233 genes comprised in aGC B cell signature (Green et al., 2011) in normal B cell populations, MYC and P110* co-expressing tumor samples (n = 6) as well as other mouse lymphomas (IμHABcl6 (n = 4) and IμHABcl6/λMyc (n = 3); mean-centered log2 gene expression ratios are depicted by color scale). The meta-analysis was based on GEP data from Green et al. (GEO26408) and own experiments (GEO35219). Additional information is provided in the Supplemental Experimental Procedures. See also Figure S3.
Figure 5
Figure 5. MYC and P110* Co-Expressing Tumors Resemble Human BL
(A) Heat map showing relative transcript levels of the top 100 up- and downregulated genes distinguishing MYC and P110* co-expressing tumors (n = 6) from IμHABcl6 induced lymphomas (n = 4) as determined by SAM analysis (FDR < 0.05). (B) p-values for the positive association of two human BL signatures (Dave et al., 2006; Hummel et al., 2006) with the MYC + P110* tumor signature as defined by SAM analysis. (C) Representative immunohistochemical staining for MYC in tumor no. 7, primary human BL no. 363 and control spleen (derived from a Cγ1-cre, R26StopFLeYFP animal 10 days after SRBC immunization). In total seven mouse tumors and nine primary human BL were analyzed. (D) Western blot analysis for MYC expression in five primary mouse tumors (tumor nos. 6, 7, 11, 19, and 84), one cell line derived from mouse tumor no. 19 (tumor no. 19 [cell line]), four human BL cell lines (BL60, Namalwa, Raji, Ramos), and splenic B cells. Beta-actin served as loading control. *Empty lane. (E) Representative immunofluorescence analysis for BCL2 (red), B220 (blue), and IgD (green) in two tumors (tumor no. 78 and tumor no. 20) and control spleen (derived from a C57BL/6 animal 10 days after SRBC immunization).
Figure 6
Figure 6. Lymphomas Originating from MYC and P110* Co-Expressing GC B Cells Display Genetic Aberrations Commonly Found in Human BL
(A) Summary of genomic aberrations detected by SNP microarray analysis in 6 MYC and P110* co-expressing tumors. (B) Schematic view of mouse chromosome 6 and its syntenic regions in human (based on Ensembl genome browser 65). Syntenic regions that have been described as gained in human BL (Boerma et al., 2009; Scholtysik et al., 2012) are marked in red. (C) Number and classification of somatically acquired mutations based on exome sequencing in MYC and P110* co-expressing tumors (n = 5). (D) Sanger sequencing of the Ccnd3 mutation (A1129G) in mouse tumor no. 19 and the corresponding germline DNA (upper and middle panel). In human BL no. 4 the CCND3 mutation (C1013T) affects the same codon as detected in the mouse tumor (lower panel). (E) Summary of CCND3 mutations detected by Sanger Sequencing in 29 primary BL samples. Positions that are also affected in the mouse tumors are marked in red. See also Figure S4 and Table S2.
Figure 7
Figure 7. PI3K Pathway Activation in Human BL
(A) Scatter plot of the PI3K pathway activity (Gustafson et al., 2010) index against the MYC activation index (Bild et al., 2006) in human BL (GEO accession number GSE35219) (Hummel et al., 2006). Samples classified as molecular BL (mBL), intermediate, and non-mBL in the original study are shown as red, gray, and blue dots, respectively. (B) Western blot analysis for Phospho-AKT (Ser473), AKT, phospho-S6 kinase (Thr389), and S6 kinase expression in five human BL cell lines (BJAB, BL60, Namalwa, Raji, Ramos). Cells were either treated with LY-294002 (+) or DMSO (−) 1 hr before protein extraction. *unspecific band. (C) Representative immunohistochemical staining for MYC, phospho-AKT (Ser473), phospho-S6 (Ser235/236) in two primary human BL (human BL nos. 420 and 889). In total nine human BL were analyzed.

Comment in

Similar articles

Cited by

  • The case of the missing c-Myc.
    Shaffer AL 3rd, Staudt LM. Shaffer AL 3rd, et al. Nat Immunol. 2012 Nov;13(11):1029-31. doi: 10.1038/ni.2455. Nat Immunol. 2012. PMID: 23080195 No abstract available.
  • Base-pair resolution DNA methylome of the EBV-positive Endemic Burkitt lymphoma cell line DAUDI determined by SOLiD bisulfite-sequencing.
    Kreck B, Richter J, Ammerpohl O, Barann M, Esser D, Petersen BS, Vater I, Murga Penas EM, Bormann Chung CA, Seisenberger S, Lee Boyd V, Smallwood S, Drexler HG, Macleod RA, Hummel M, Krueger F, Häsler R, Schreiber S, Rosenstiel P, Franke A, Siebert R. Kreck B, et al. Leukemia. 2013 Aug;27(8):1751-3. doi: 10.1038/leu.2013.4. Epub 2013 Jan 11. Leukemia. 2013. PMID: 23307032 Free PMC article. No abstract available.
  • The complex pathophysiology of acquired aplastic anaemia.
    Zeng Y, Katsanis E. Zeng Y, et al. Clin Exp Immunol. 2015 Jun;180(3):361-70. doi: 10.1111/cei.12605. Epub 2015 Apr 23. Clin Exp Immunol. 2015. PMID: 25683099 Free PMC article. Review.
  • Recurrent mutation of the ID3 gene in Burkitt lymphoma identified by integrated genome, exome and transcriptome sequencing.
    Richter J, Schlesner M, Hoffmann S, Kreuz M, Leich E, Burkhardt B, Rosolowski M, Ammerpohl O, Wagener R, Bernhart SH, Lenze D, Szczepanowski M, Paulsen M, Lipinski S, Russell RB, Adam-Klages S, Apic G, Claviez A, Hasenclever D, Hovestadt V, Hornig N, Korbel JO, Kube D, Langenberger D, Lawerenz C, Lisfeld J, Meyer K, Picelli S, Pischimarov J, Radlwimmer B, Rausch T, Rohde M, Schilhabel M, Scholtysik R, Spang R, Trautmann H, Zenz T, Borkhardt A, Drexler HG, Möller P, MacLeod RA, Pott C, Schreiber S, Trümper L, Loeffler M, Stadler PF, Lichter P, Eils R, Küppers R, Hummel M, Klapper W, Rosenstiel P, Rosenwald A, Brors B, Siebert R; ICGC MMML-Seq Project. Richter J, et al. Nat Genet. 2012 Dec;44(12):1316-20. doi: 10.1038/ng.2469. Epub 2012 Nov 11. Nat Genet. 2012. PMID: 23143595
  • Identification of clinical molecular targets for childhood Burkitt lymphoma.
    Zhang J, Meng L, Jiang W, Zhang H, Zhou A, Zeng N. Zhang J, et al. Transl Oncol. 2020 Dec;13(12):100855. doi: 10.1016/j.tranon.2020.100855. Epub 2020 Sep 15. Transl Oncol. 2020. PMID: 32947237 Free PMC article.

References

    1. Adams JM, Cory S. Myc oncogene activation in B and T lymphoid tumours. Proc. R. Soc. Lond. B Biol. Sci. 1985;226:59–72. - PubMed
    1. Alizadeh AA, Eisen MB, Davis RE, Ma C, Lossos IS, Rosenwald A, Boldrick JC, Sabet H, Tran T, Yu X, et al. Distinct types of diffuse large B-cell lymphoma identified by gene expression profiling. Nature. 2000;403:503–511. - PubMed
    1. Barrett MT, Sanchez CA, Prevo LJ, Wong DJ, Galipeau PC, Paulson TG, Rabinovitch PS, Reid BJ. Evolution of neoplastic cell lineages in Barrett oesophagus. Nat. Genet. 1999;22:106–109. - PMC - PubMed
    1. Bengtsson H, Irizarry R, Carvalho B, Speed TP. Estimation and assessment of raw copy numbers at the single locus level. Bioinformatics. 2008;24:759–767. - PubMed
    1. Bhatia KG, Gutiérrez MI, Huppi K, Siwarski D, Magrath IT. The pattern of p53 mutations in Burkitt’s lymphoma differs from that of solid tumors. Cancer Res. 1992;52:4273–4276. - PubMed

Publication types

MeSH terms

Substances

Associated data