A distinct influenza infection signature in the blood transcriptome of patients with severe community-acquired pneumonia
- PMID: 22898401
- PMCID: PMC3580747
- DOI: 10.1186/cc11477
A distinct influenza infection signature in the blood transcriptome of patients with severe community-acquired pneumonia
Abstract
Introduction: Diagnosis of severe influenza pneumonia remains challenging because of a lack of correlation between the presence of influenza virus and clinical status. We conducted gene-expression profiling in the whole blood of critically ill patients to identify a gene signature that would allow clinicians to distinguish influenza infection from other causes of severe respiratory failure, such as bacterial pneumonia, and noninfective systemic inflammatory response syndrome.
Methods: Whole-blood samples were collected from critically ill individuals and assayed on Illumina HT-12 gene-expression beadarrays. Differentially expressed genes were determined by linear mixed-model analysis and overrepresented biological pathways determined by using GeneGo MetaCore.
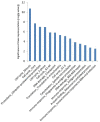
Results: The gene-expression profile of H1N1 influenza A pneumonia was distinctly different from those of bacterial pneumonia and systemic inflammatory response syndrome. The influenza gene-expression profile is characterized by upregulation of genes from cell-cycle regulation, apoptosis, and DNA-damage-response pathways. In contrast, no distinctive gene-expression signature was found in patients with bacterial pneumonia or systemic inflammatory response syndrome. The gene-expression profile of influenza infection persisted through 5 days of follow-up. Furthermore, in patients with primary H1N1 influenza A infection in whom bacterial co-infection subsequently developed, the influenza gene-expression signature remained unaltered, despite the presence of a superimposed bacterial infection.
Conclusions: The whole-blood expression-profiling data indicate that the host response to influenza pneumonia is distinctly different from that caused by bacterial pathogens. This information may speed the identification of the cause of infection in patients presenting with severe respiratory failure, allowing appropriate patient care to be undertaken more rapidly.
Figures


Comment in
-
The host response to infection: advancing a novel diagnostic paradigm.Crit Care. 2012 Nov 6;16(6):168. doi: 10.1186/cc11685. Crit Care. 2012. PMID: 23134694 Free PMC article.
References
-
- Revised global burden of disease 2002 estimates. http://www.who.int/healthinfo/global_burden_disease/estimates_regional_2...
-
- Piacentini E, Sanchez B, Arauzo V, Calbo E, Cuchi E, Nava JM. Procalcitonin levels are lower in intensive care unit patients with H1N1 influenza A virus pneumonia than in those with community-acquired bacterial pneumonia: a pilot study. J Crit Care. 2011;26:201–205. doi: 10.1016/j.jcrc.2010.07.009. - DOI - PubMed
Publication types
MeSH terms
LinkOut - more resources
Full Text Sources
Other Literature Sources
Medical
Molecular Biology Databases

