. 2012 Dec;22(12):2339-55.
doi: 10.1101/gr.132738.111. Epub 2012 Aug 16.

A heterozygous IDH1R132H/WT mutation induces genome-wide alterations in DNA methylation

Affiliations

A heterozygous IDH1R132H/WT mutation induces genome-wide alterations in DNA methylation

Christopher G Duncan et al. Genome Res. 2012 Dec.

Abstract

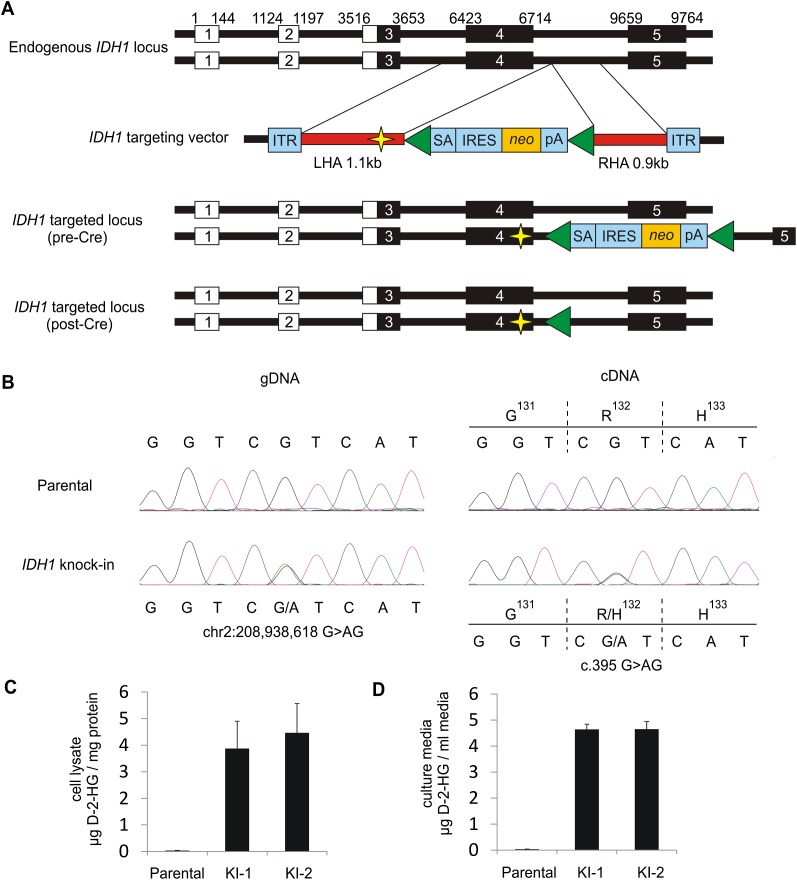
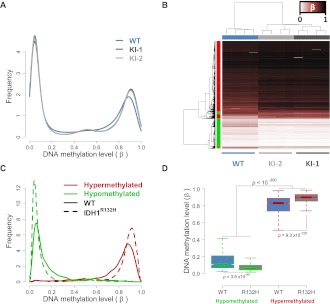
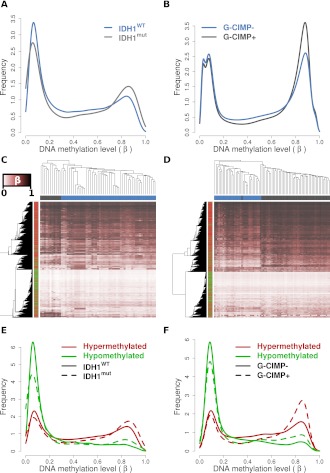
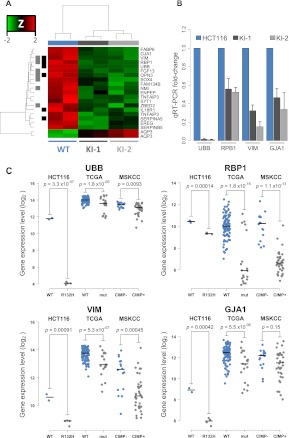
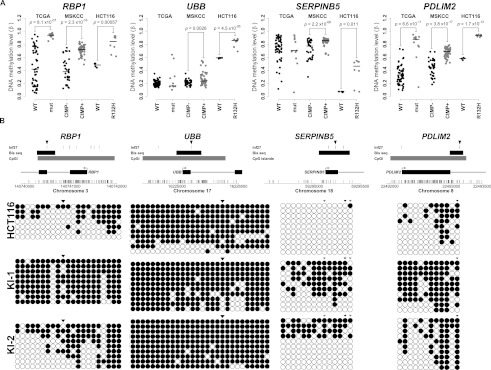
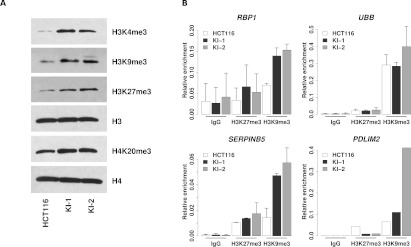
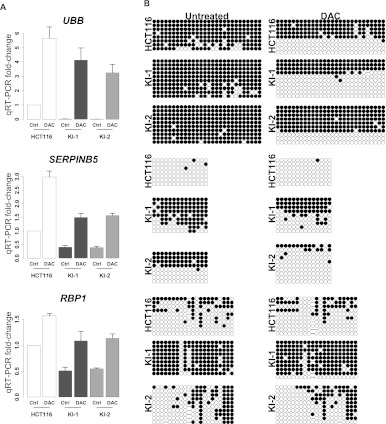
Monoallelic point mutations of the NADP(+)-dependent isocitrate dehydrogenases IDH1 and IDH2 occur frequently in gliomas, acute myeloid leukemias, and chondromas, and display robust association with specific DNA hypermethylation signatures. Here we show that heterozygous expression of the IDH1(R132H) allele is sufficient to induce the genome-wide alterations in DNA methylation characteristic of these tumors. Using a gene-targeting approach, we knocked-in a single copy of the most frequently observed IDH1 mutation, R132H, into a human cancer cell line and profiled changes in DNA methylation at over 27,000 CpG dinucleotides relative to wild-type parental cells. We find that IDH1(R132H/WT) mutation induces widespread alterations in DNA methylation, including hypermethylation of 2010 and hypomethylation of 842 CpG loci. We demonstrate that many of these alterations are consistent with those observed in IDH1-mutant and G-CIMP+ primary gliomas and can segregate IDH wild-type and mutated tumors as well as those exhibiting the G-CIMP phenotype in unsupervised analysis of two primary glioma cohorts. Further, we show that the direction of IDH1(R132H/WT)-mediated DNA methylation change is largely dependent upon preexisting DNA methylation levels, resulting in depletion of moderately methylated loci. Additionally, whereas the levels of multiple histone H3 and H4 methylation modifications were globally increased, consistent with broad inhibition of histone demethylation, hypermethylation at H3K9 in particular accompanied locus-specific DNA hypermethylation at several genes down-regulated in IDH1(R132H/WT) knock-in cells. These data provide insight on epigenetic alterations induced by IDH1 mutations and support a causal role for IDH1(R132H/WT) mutants in driving epigenetic instability in human cancer cells.


Figures

Figure 1.
Figure 1.
Targeted knock-in of IDH1R132H/WT hotspot mutation in a human cancer cell line. (A) To faithfully recapitulate expression of heterozygous IDH1R132H/WT mutations as observed in human tumors, a targeting vector was designed to introduce the IDH1R132H mutation in one endogenous allele of IDH1 in HCT116. Relative genomic positions of exons are indicated, including 5′ UTR (white boxes) and coding sequences (black boxes). Homology arms (HAs) were cloned from HCT116 parental cells and are shown in red. The left HA (LHA) was altered by site-directed mutagenesis to create the IDH1R132H mutation (indicated by yellow star). The homology arms flank a synthetic exon promoter trap (SEPT) cassette. The promoterless SEPT element contains a splice acceptor (SA), internal ribosomal entry sequence (IRES), neomycin selectable marker (neo), and polyadenylation site (pA), which are flanked by loxP sites (green triangles). Inverted terminal repeats (ITR) of the adeno-associated virus (AAV) vector flank the homology arms. Correctly targeted alleles result in incorporation of the SEPT cassette along with the R132H mutation. Targeted clones were infected with Cre adenovirus to excise the selectable element, generating a clone that differs from the parental cell line by the single base pair mutation in exon 4 and 34-bp loxP scar in the adjacent intron. (B) Sequencing validation of IDH1R132H/WT knock-in clones. Representative sequencing chromatograms for IDH1 codons 131–133 in genomic DNA (left) and cDNA (right) of HCT116 parental cells (top) and IDH1 knock-in cells (bottom). Knock-in clones contain a heterozygous G>AG mutation at chr2:208,938,618 and are heterozygous for wild-type allele (CGT) and mutant allele (CAT) coding for an arginine (R) to histidine (H) change at amino acid 132. Measurement of D-2-hydroxyglutarate (D-2-HG) in (C) clarified cell lysate and (D) cell culture medium over cells, collected after 48 h incubation. Shown is the mean ±SD of triplicate measurements.
Figure 2.
Figure 2.
IDH1R132H/WT-induced DNA methylation alterations in HCT116 cells. HCT116-IDH1R132H/WT knock-in clones and parental cells were analyzed using the Illumina HumanMethylation27 assay. (A) Relative DNA methylation (β) distribution for IDH1WT HCT116 parental cells (blue) and IDH1R132H/WT knock-in clones (light- and dark-gray). Frequency (y-axis) is plotted by β such that the total probability (area under the curve) is equal to one. Both knock-in clones show an increase in methylated loci as compared with the wild-type parental cells. (B) Hierarchical clustering of HCT116 samples using IDH1R132H/WT differential loci. Samples are represented by columns and differential CpG loci by rows. Samples are annotated by IDH1 genotype where the wild-type parental cells are in blue and the IDH1R132H/WT knock-ins (KI-1, KI-2) are in light- and dark-gray. CpG loci are annotated by their differential methylation, where red is hypermethylated (FDR < 0.01, n = 2010) and green is hypomethylated (n = 842) in IDH1R132H/WT knock-ins as compared with the wild-type parental line. The color of the heat map represents β, where unmethylated is white (β = 0), partially methylated is burgundy (β = 0.5), and fully methylated is black (β = 1). Clustering is performed with an average clustering algorithm and Euclidean distance dissimilarity metric. (C) Relative DNA methylation distribution for HCT116 IDH1R132H/WT differentially methylated loci. Frequency of the differentially methylated loci are plotted relative to β for hypomethylated (green) and hypermethylated loci (red) in wild-type parental cells (WT: solid line) and IDH1R132H/WT knock-in cells (IDH1R132H: dashed line), such that the total probability (area under any given curve) is equal to one. (D) Box-and-whisker plot of DNA methylation levels for hypomethylated and hypermethylated loci in wild-type (WT) and IDH1R132H/WT knock-in cells (R132H). Loci that were hypermethylated have a higher methylation level in parental cells than loci that were hypomethylated (P < 10−300; Mann-Whitney U-test).
Figure 3.
Figure 3.
IDH1 mutant and G-CIMP+ gliomas recapitulate the DNA methylation alterations observed in cell line models. (A) Relative DNA methylation (β) distribution for 61 TCGA GBMs with definitive IDH1 mutational status and HumanMethylation27 data available (Noushmehr et al. 2010). Tumors that have wild-type (IDH1WT: blue) and mutated (IDH1mut: gray) IDH1 are drawn separately. (B) Relative β distribution for 81 LGGs from Turcan et al. (2012) classified as G-CIMP negative (G-CIMP-: blue) or positive (G-CIMP+: gray) profiled on the HumanMethylation450 array. Hierarchical clustering of the (C) TCGA GBM and (D) Turcan et al. (2012) LGG cohorts using the 2852 HCT116 IDH1R132H/WT differentially methylated loci separates IDH1WT from IDH1mut and G-CIMP+ from G-CIMP− tumors (P < 0.001). Samples are represented by columns and CpG loci by rows. Samples are annotated by IDH1 genotype for wild-type (blue) and mutated (gray) tumors. CpG loci are annotated by their differential methylation status, where red is hypermethylated and green is hypomethylated in HCT116 IDH1R132H/WT. The color of the heat map represents β, where unmethylated is white (β = 0), partially methylated is burgundy (β = 0.5), and fully methylated is black (β = 1). Clustering was performed with an average clustering agglomerative algorithm and Euclidean distance dissimilarity metric. Relative β distribution of HCT116 IDH1R132H/WT differentially methylated loci in the (E) TCGA GBM and (F) Turcan et al. (2012) LGG cohorts. Frequency of the differentially methylated loci are plotted relative to β for hypomethylated (green) and hypermethylated loci (red) in IDH wild-type or G-CIMP− tumors (solid line) and IDH mutant or G-CIMP+ tumors (dashed line).
Figure 4.
Figure 4.
Gene expression profiling of HCT116 IDH1R132H/WT cell lines. HCT116 IDH1R132H/WT knock-in clones and parental cells were analyzed using Affymetrix Human Genome 2.0 Arrays. (A) Hierarchical clustering of probes differentially expressed in HCT116 parent versus knock-in cells. Samples are represented by columns and differential probes by rows. Samples are annotated by IDH1 genotype for wild-type HCT116 (blue) and IDH1R132H/WT knock-in cells (gray). Each probe is normalized (Z-score), and the color of the heat map represents the relative expression of each sample (red: overexpressed; green: underexpressed). Probes are annotated for overlap with genes found differentially expressed in TCGA GBMs (black) (Noushmehr et al. 2010) and LGGs (gray) (Turcan et al. 2012). Clustering is performed using an average clustering algorithm and a Euclidean distance dissimilarity metric of the normalized expression. (B) Quantitative real-time PCR (Q-PCR) validation of candidate genes UBB, RBP1, VIM, and GJA1 for IDH1R132H/WT–mediated transcriptional repression. Gene expression fold-changes were quantified for each candidate gene by using three independent mRNA samples from each clone and calculated relative to parental cell line. Shown is the mean ±SD of the triplicate determinations relative to HCT116 cells. (C) Stripcharts of gene expression values for validated genes in HCT116 parental (WT: blue) and IDH1R132H/WT (R132H: gray) cells as well as the same probes from 117 TCGA primary GBMs that are IDH1 wild-type (WT: blue, n = 98) or mutated (mut: gray, n = 19) and 52 LGGs that have gene expression data and G-CIMP negative (CIMP−: blue; n = 16) or positive (CIMP+: gray; n = 36) classification. (Lines) Median values for each group. P-values were calculated using Welch's two-sided t-test.
Figure 5.
Figure 5.
Bisulfite sequence analysis of candidate CpG loci validates IDH1R132H/WT-induced DNA methylation changes. (A) Stripcharts of DNA methylation values (β) in HCT116 parental (WT: black) and IDH1R132H/WT (R132H: gray) cells are shown next to data for the same loci in TCGA GBMs that are IDH1 wild-type (WT: black) or mutated (mut: gray) and LGGs that are G-CIMP negative (CIMP−: black) or positive (CIMP+: gray). P-values are from Welch's two-sided t-test. (B) Bisulfite sequence analysis of the loci shown in A. (Top) The interrogated region is depicted with a schematic of the gene with CpG dinucleotides represented by vertical tick marks on the x-axis. Browser tracks denote CpG islands, the region analyzed by bisulfite sequencing (Bis seq) and CpG loci interrogated by the HumanMethylation27 platform (Inf27). The CpG locus plotted in A is denoted by a black arrowhead above the Inf27 track. (Bottom) Bisulfite sequencing results for the regions denoted in the schematic above. Each row represents a sequenced allele and each dot represents a CpG. (Black dots) Methylated CpGs; (white dots) unmethylated CpGs. The CpG shown in A is denoted with a black arrowhead, and other CpGs interrogated by the assay are shown in gray.
Figure 6.
Figure 6.
Global and gene-specific histone lysine methylation coincides with IDH1R132H/WT-induced DNA methylation. (A) Western blots for total H3K4me3, H3K9me3, H3K27me3, and H4K20me3 histone modifications for parental (HCT116) and IDH1R132H/WT knock-in (KI-1, KI-2) cell lines. Also shown are total H3 and H4 controls. (B) ChIP was performed using antibodies against H3K9me3, H3K27me3, pan-H3, or IgG and immunoprecipitated DNA quantified by Q-PCR using primers specific to the promoter regions of the indicated genes. (Bar graphs) The mean enrichment of the specific histone mark relative to that of total histone H3 for the same genomic region. (Error bars) Standard deviation of two independent experiments except for PDLIM2.
Figure 7.
Figure 7.
Inhibition of DNA methylation results in restoration of gene expression for IDH1R132H/WT-repressed loci. (A) Candidate gene expression reactivation in 5-aza-2′-deoxycytidine-treated IDH1-mutant cell lines. Parental or IDH1R132H/WT knock-in (KI-1, KI-2) cells were treated with 5 μM of 5-aza-2′-deoxycytidine (DAC) or control (PBS) for 48 h. Following treatment, relative mRNA levels of UBB, RBP1, and SERPINB5 were measured by Q-PCR. (Bar graph) Expression fold-change relative to untreated parental cell line. (Error bars) Standard deviation of three independent experiments. (B) Bisulfite sequencing analysis of candidate genes in A for untreated and DAC-treated cell lines. Each row represents a sequenced allele and each dot represents a CpG. (Black dots) Methylated CpGs; (white dots) unmethylated CpGs.

References

    1. Amary MF, Bacsi K, Maggiani F, Damato S, Halai D, Berisha F, Pollock R, O'Donnell P, Grigoriadis A, Diss T, et al. 2011. IDH1 and IDH2 mutations are frequent events in central chondrosarcoma and central and periosteal chondromas but not in other mesenchymal tumours. J Pathol 224: 334–343 - PubMed
    1. Balss J, Meyer J, Mueller W, Korshunov A, Hartmann C, von Deimling A 2008. Analysis of the IDH1 codon 132 mutation in brain tumors. Acta Neuropathol 116: 597–602 - PubMed
    1. Barbus S, Tews B, Karra D, Hahn M, Radlwimmer B, Delhomme N, Hartmann C, Felsberg J, Krex D, Schackert G, et al. 2011. Differential retinoic acid signaling in tumors of long- and short-term glioblastoma survivors. J Natl Cancer Inst 103: 598–606 - PubMed
    1. Birney E, Stamatoyannopoulos JA, Dutta A, Guigó R, Gingeras TR, Margulies EH, Weng Z, Snyder M, Dermitzakis ET, Thurman RE, et al. 2007. Identification and analysis of functional elements in 1% of the human genome by the ENCODE pilot project. Nature 447: 799–816 - PMC - PubMed
    1. Bleeker FE, Lamba S, Leenstra S, Troost D, Hulsebos T, Vandertop WP, Frattini M, Molinari F, Knowles M, Cerrato A, et al. 2009. IDH1 mutations at residue p.R132 (IDH1R132) occur frequently in high-grade gliomas but not in other solid tumors. Hum Mutat 30: 7–11 - PubMed

Publication types

MeSH terms