

Automatic segmentation and supervised learning-based selection of nuclei in cancer tissue images
- PMID: 22899462
- PMCID: PMC6362837
- DOI: 10.1002/cyto.a.22097
Automatic segmentation and supervised learning-based selection of nuclei in cancer tissue images
Abstract
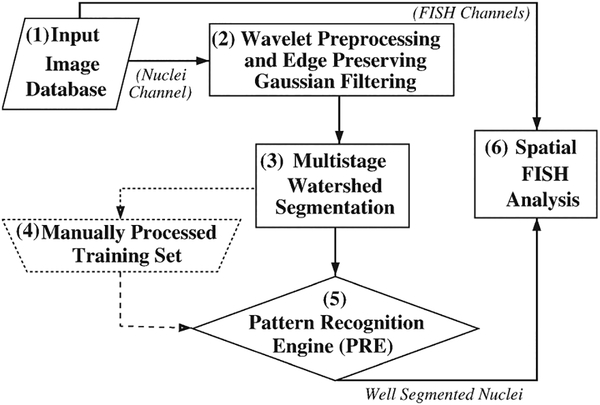
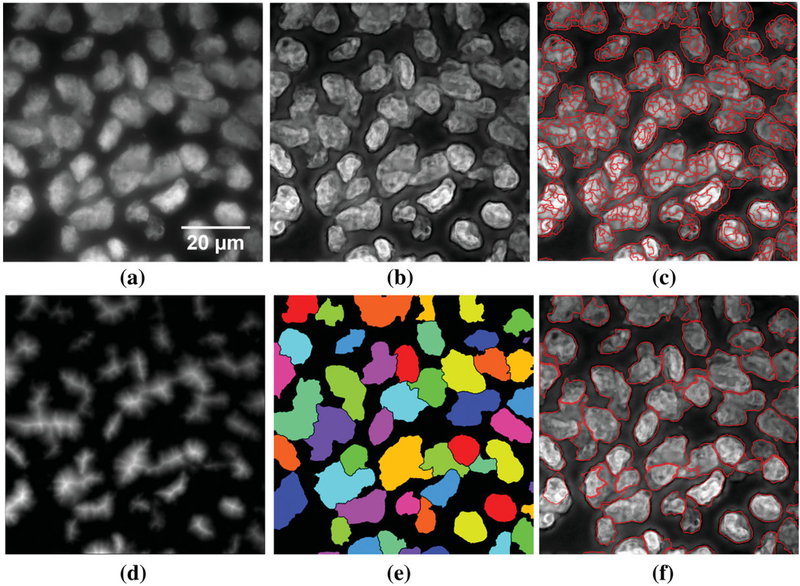
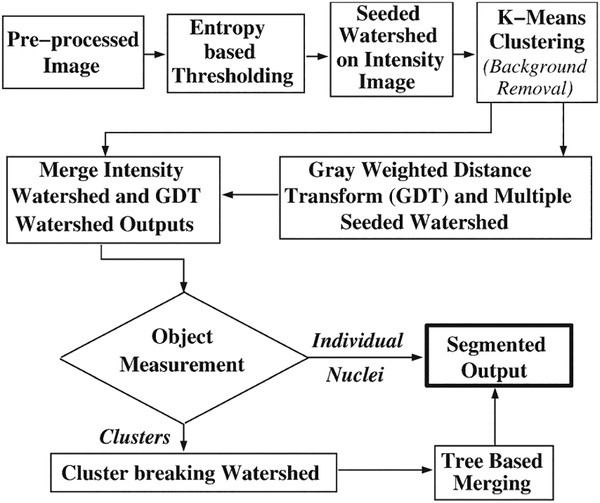
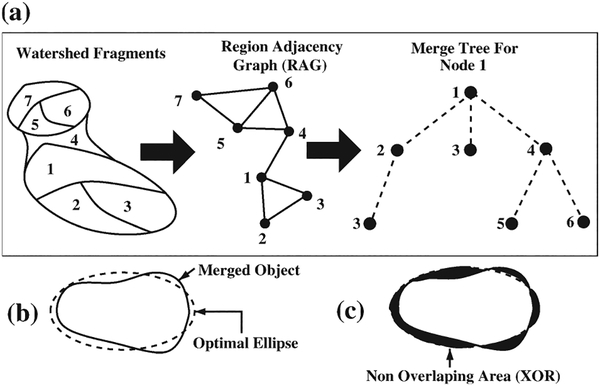
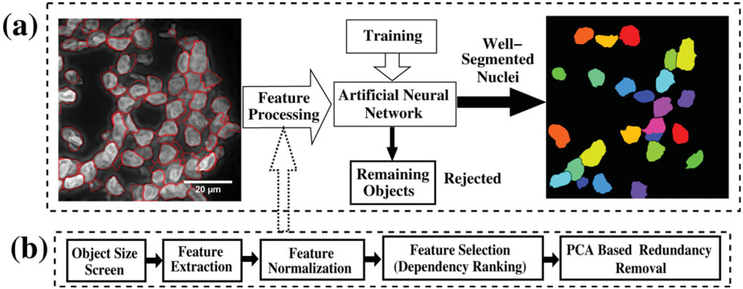
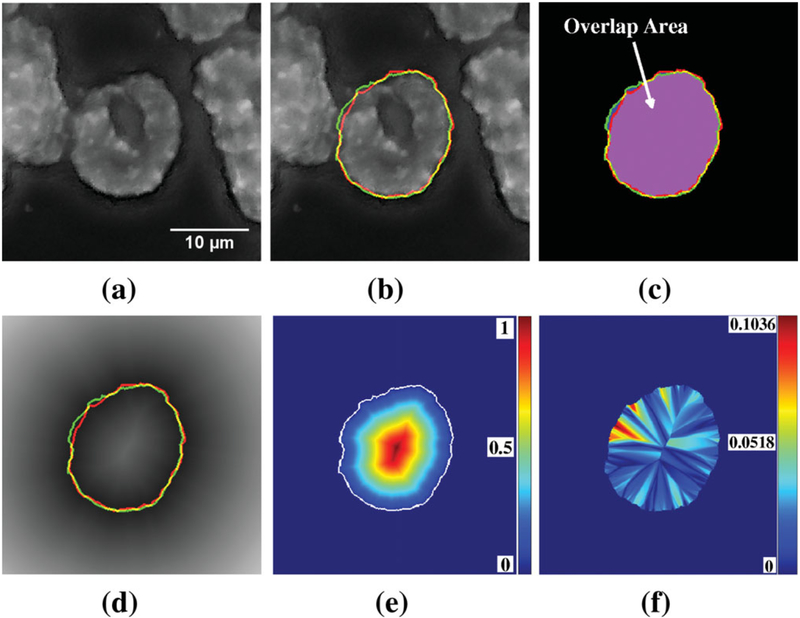
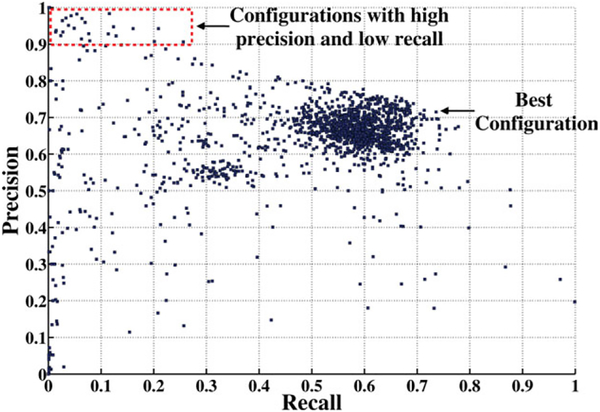
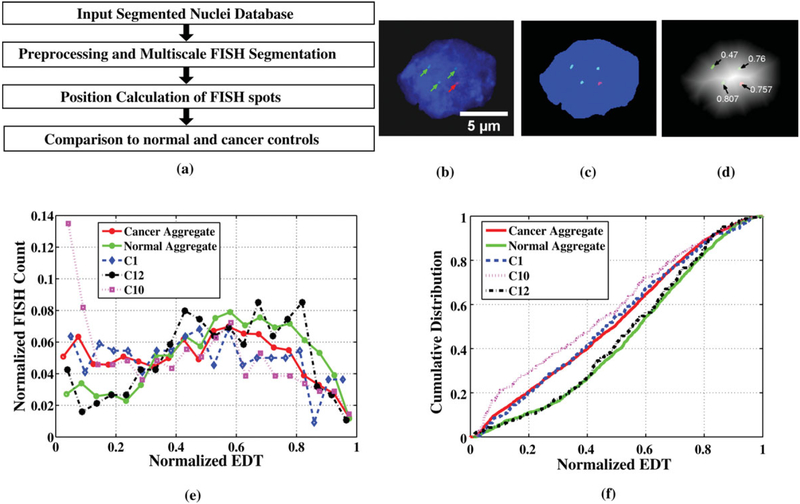
Analysis of preferential localization of certain genes within the cell nuclei is emerging as a new technique for the diagnosis of breast cancer. Quantitation requires accurate segmentation of 100-200 cell nuclei in each tissue section to draw a statistically significant result. Thus, for large-scale analysis, manual processing is too time consuming and subjective. Fortuitously, acquired images generally contain many more nuclei than are needed for analysis. Therefore, we developed an integrated workflow that selects, following automatic segmentation, a subpopulation of accurately delineated nuclei for positioning of fluorescence in situ hybridization-labeled genes of interest. Segmentation was performed by a multistage watershed-based algorithm and screening by an artificial neural network-based pattern recognition engine. The performance of the workflow was quantified in terms of the fraction of automatically selected nuclei that were visually confirmed as well segmented and by the boundary accuracy of the well-segmented nuclei relative to a 2D dynamic programming-based reference segmentation method. Application of the method was demonstrated for discriminating normal and cancerous breast tissue sections based on the differential positioning of the HES5 gene. Automatic results agreed with manual analysis in 11 out of 14 cancers, all four normal cases, and all five noncancerous breast disease cases, thus showing the accuracy and robustness of the proposed approach.
Published 2012 Wiley Periodicals, Inc.
Figures
Similar articles
-
Ranked retrieval of segmented nuclei for objective assessment of cancer gene repositioning.BMC Bioinformatics. 2012 Sep 12;13:232. doi: 10.1186/1471-2105-13-232. BMC Bioinformatics. 2012. PMID: 22971117 Free PMC article.
-
Supervised learning framework for screening nuclei in tissue sections.Annu Int Conf IEEE Eng Med Biol Soc. 2011;2011:5989-92. doi: 10.1109/IEMBS.2011.6091480. Annu Int Conf IEEE Eng Med Biol Soc. 2011. PMID: 22255704 Free PMC article.
-
Automatic segmentation of cell nuclei in Feulgen-stained histological sections of prostate cancer and quantitative evaluation of segmentation results.Cytometry A. 2012 Jul;81(7):588-601. doi: 10.1002/cyto.a.22068. Epub 2012 May 17. Cytometry A. 2012. PMID: 22605528
-
Breast cancer cell nuclei classification in histopathology images using deep neural networks.Int J Comput Assist Radiol Surg. 2018 Feb;13(2):179-191. doi: 10.1007/s11548-017-1663-9. Epub 2017 Aug 31. Int J Comput Assist Radiol Surg. 2018. PMID: 28861708 Review.
-
A survey on cell nuclei instance segmentation and classification: Leveraging context and attention.Med Image Anal. 2025 Jan;99:103360. doi: 10.1016/j.media.2024.103360. Epub 2024 Oct 5. Med Image Anal. 2025. PMID: 39383642 Review.
Cited by
-
A flexible and robust approach for segmenting cell nuclei from 2D microscopy images using supervised learning and template matching.Cytometry A. 2013 May;83(5):495-507. doi: 10.1002/cyto.a.22280. Epub 2013 Apr 8. Cytometry A. 2013. PMID: 23568787 Free PMC article.
-
FogBank: a single cell segmentation across multiple cell lines and image modalities.BMC Bioinformatics. 2014 Dec 30;15(1):431. doi: 10.1186/s12859-014-0431-x. BMC Bioinformatics. 2014. PMID: 25547324 Free PMC article.
-
Ranked retrieval of segmented nuclei for objective assessment of cancer gene repositioning.BMC Bioinformatics. 2012 Sep 12;13:232. doi: 10.1186/1471-2105-13-232. BMC Bioinformatics. 2012. PMID: 22971117 Free PMC article.
-
A Methodology for Texture Feature-based Quality Assessment in Nucleus Segmentation of Histopathology Image.J Pathol Inform. 2017 Sep 7;8:38. doi: 10.4103/jpi.jpi_43_17. eCollection 2017. J Pathol Inform. 2017. PMID: 28966837 Free PMC article.
-
Introduction to Digital Image Analysis in Whole-slide Imaging: A White Paper from the Digital Pathology Association.J Pathol Inform. 2019 Mar 8;10:9. doi: 10.4103/jpi.jpi_82_18. eCollection 2019. J Pathol Inform. 2019. PMID: 30984469 Free PMC article. Review.
References
-
- American Cancer Society. Cancer Facts & Figures 2011. Atlanta: American Cancer Society; 2011.
-
- Bishop JM. The molecular genetics of cancer. Science 1987;235:305–311. - PubMed
-
- Gasser S Positions of potential:nuclear organization and gene expression. Cell 2001;104:639–642. - PubMed
-
- Meaburn KJ, Misteli T. Cell biology: Chromosome territories. Nature 2007;445:379–381. - PubMed
-
- Parada LA, Misteli T. Chromosome positioning in the interphase nucleus. Trends Cell Biol 2002;12:425–432. - PubMed
Publication types
MeSH terms
Substances
Grants and funding
LinkOut - more resources
Full Text Sources
Other Literature Sources
Medical
