

Influence of common genetic variation on lung cancer risk: meta-analysis of 14 900 cases and 29 485 controls
- PMID: 22899653
- PMCID: PMC3607485
- DOI: 10.1093/hmg/dds334
Influence of common genetic variation on lung cancer risk: meta-analysis of 14 900 cases and 29 485 controls
Abstract
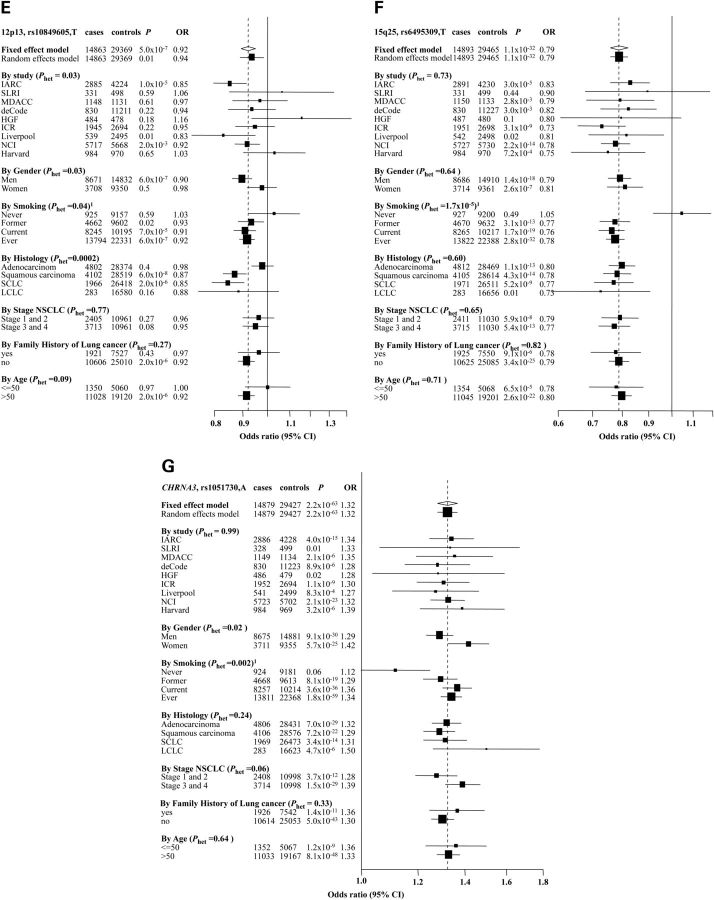
Recent genome-wide association studies (GWASs) have identified common genetic variants at 5p15.33, 6p21-6p22 and 15q25.1 associated with lung cancer risk. Several other genetic regions including variants of CHEK2 (22q12), TP53BP1 (15q15) and RAD52 (12p13) have been demonstrated to influence lung cancer risk in candidate- or pathway-based analyses. To identify novel risk variants for lung cancer, we performed a meta-analysis of 16 GWASs, totaling 14 900 cases and 29 485 controls of European descent. Our data provided increased support for previously identified risk loci at 5p15 (P = 7.2 × 10(-16)), 6p21 (P = 2.3 × 10(-14)) and 15q25 (P = 2.2 × 10(-63)). Furthermore, we demonstrated histology-specific effects for 5p15, 6p21 and 12p13 loci but not for the 15q25 region. Subgroup analysis also identified a novel disease locus for squamous cell carcinoma at 9p21 (CDKN2A/p16(INK4A)/p14(ARF)/CDKN2B/p15(INK4B)/ANRIL; rs1333040, P = 3.0 × 10(-7)) which was replicated in a series of 5415 Han Chinese (P = 0.03; combined analysis, P = 2.3 × 10(-8)). This large analysis provides additional evidence for the role of inherited genetic susceptibility to lung cancer and insight into biological differences in the development of the different histological types of lung cancer.
Figures


References
-
- Parkin D.M., Bray F., Ferlay J., Pisani P. Global cancer statistics, 2002. CA Cancer J. Clin. 2005;55:74–108. - PubMed
-
- Gazdar A., Franklin W.A., Brambilla E., Hainaut P., Yokota J., Harris C.C. In: World Health Organization Classification of Tumors. Pathology and Genetics of Tumors of the Lung, Pleura and Heart. Travis W.D., Brambilla E., Muller-Hermelink H.K., Harris C.C., editors. Lyon: IARCPress; 2004. pp. 21–23.
-
- Brennan P., Hainaut P., Boffetta P. Genetics of lung-cancer susceptibility. Lancet Oncol. 2011;12:399–408. - PubMed
-
- Hung R.J., McKay J.D., Gaborieau V., Boffetta P., Hashibe M., Zaridze D., Mukeria A., Szeszenia-Dabrowska N., Lissowska J., Rudnai P., et al. A susceptibility locus for lung cancer maps to nicotinic acetylcholine receptor subunit genes on 15q25. Nature. 2008;452:633–637. - PubMed
Publication types
MeSH terms
Grants and funding
- R01 CA121197/CA/NCI NIH HHS/United States
- N01-CN-25512/CN/NCI NIH HHS/United States
- N01-CN-25515/CN/NCI NIH HHS/United States
- N01 CN075022/CA/NCI NIH HHS/United States
- R01 CA055769/CA/NCI NIH HHS/United States
- N01-CN-45165/CN/NCI NIH HHS/United States
- ImNIH/Intramural NIH HHS/United States
- N01-CN-25476/CN/NCI NIH HHS/United States
- N01-CN-25522/CN/NCI NIH HHS/United States
- R01 CA55769/CA/NCI NIH HHS/United States
- R01 CA092039/CA/NCI NIH HHS/United States
- N01-CN-25524/CN/NCI NIH HHS/United States
- P20 CA090578/CA/NCI NIH HHS/United States
- U19 CA148127/CA/NCI NIH HHS/United States
- U01HG004438/HG/NHGRI NIH HHS/United States
- N01-CN-25513/CN/NCI NIH HHS/United States
- R01 CA092824/CA/NCI NIH HHS/United States
- N01-RC-45035/RC/CCR NIH HHS/United States
- U01 HG004438/HG/NHGRI NIH HHS/United States
- N01-CN-25511/CN/NCI NIH HHS/United States
- N01 CN025512/CA/NCI NIH HHS/United States
- U01 HG004446/HG/NHGRI NIH HHS/United States
- R01CA121197/CA/NCI NIH HHS/United States
- R01 CA133996/CA/NCI NIH HHS/United States
- U01 CA063673/CA/NCI NIH HHS/United States
- N01-CN-75022/CN/NCI NIH HHS/United States
- CA090578/CA/NCI NIH HHS/United States
- N01-CN-25514/CN/NCI NIH HHS/United States
- N01 CN025511/CA/NCI NIH HHS/United States
- U01 CA63673/CA/NCI NIH HHS/United States
- P50 CA70907/CA/NCI NIH HHS/United States
- N01 CN025522/CA/NCI NIH HHS/United States
- N01 CN025513/CA/NCI NIH HHS/United States
- CA092824/CA/NCI NIH HHS/United States
- R01 CA127219/CA/NCI NIH HHS/United States
- 5R01CA055769/CA/NCI NIH HHS/United States
- R01 CA074386/CA/NCI NIH HHS/United States
- N01 CN025524/CA/NCI NIH HHS/United States
- N01 CN025476/CA/NCI NIH HHS/United States
- HG-06033-01/HG/NHGRI NIH HHS/United States
- N01 CN025516/CA/NCI NIH HHS/United States
- C1298/A8780/CRUK_/Cancer Research UK/United Kingdom
- N01 CN025404/CA/NCI NIH HHS/United States
- N01-RC-37004/RC/CCR NIH HHS/United States
- HHSN268200782096C/HG/NHGRI NIH HHS/United States
- CA074386/CA/NCI NIH HHS/United States
- 5R01CA133996/CA/NCI NIH HHS/United States
- 5R01CA127219/CA/NCI NIH HHS/United States
- N01 CN025518/CA/NCI NIH HHS/United States
- P50 CA090578/CA/NCI NIH HHS/United States
- R01HL091172-01/HL/NHLBI NIH HHS/United States
- U19CA148127/CA/NCI NIH HHS/United States
- N01-CN-25404/CN/NCI NIH HHS/United States
- N01-CN-25516/CN/NCI NIH HHS/United States
- 5R01CA121197/CA/NCI NIH HHS/United States
- N01 CN025515/CA/NCI NIH HHS/United States
- P50 CA070907/CA/NCI NIH HHS/United States
- N01-CN-25518/CN/NCI NIH HHS/United States
- N01 CN025514/CA/NCI NIH HHS/United States
- R01 CA111703/CA/NCI NIH HHS/United States
- C1298/A8362/CRUK_/Cancer Research UK/United Kingdom
LinkOut - more resources
Full Text Sources
Other Literature Sources
Medical
Molecular Biology Databases
Research Materials
Miscellaneous
