"En face" OCT imaging of the IS/OS junction line in type 2 idiopathic macular telangiectasia
- PMID: 22899757
- PMCID: PMC4608676
- DOI: 10.1167/iovs.12-10580
"En face" OCT imaging of the IS/OS junction line in type 2 idiopathic macular telangiectasia
Abstract
Purpose: We investigated abnormalities of the photoreceptor inner/outer segment (IS/OS) junction layer viewed "en face" and their functional correlates in type 2 idiopathic macular telangiectasia (type 2 MacTel).
Methods: Segmentation and "en face" imaging of the IS/OS lines in spectral domain optical coherence tomographic (SD-OCT) volumes were performed manually. Mesopic retinal sensitivity thresholds were determined using a Nidek MP1 microperimeter. "En face" SD-OCT images and microperimetric data were superimposed over images of the fundus. Retinal structure and characteristics of type 2 MacTel were analyzed, and associations of structural changes with function were investigated.
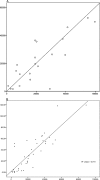
Results: We examined 49 eyes of 28 patients (mean age 62.6 ± 9.4 years). Total IS/OS break area ranged from 0.04 to 2.23 mm² (mean 0.63 mm², SD 0.53 mm²) and 0.03 to 1.49 mm² (mean 0.49 mm², SD 0.42 mm²) in right and left eyes, respectively. A correlation between fellow eyes was present (Spearman correlation ρ = 0.770, P < 0.01). An assessment of the repeatability of IS/OS lesion area measurements (n = 19 eyes) revealed an intra-class correlation coefficient of 0.99 (95% confidence interval [CI] of 0.975-0.996). Retinal areas corresponding to an IS/OS break showed a mean retinal sensitivity of 8.3 ± 5.8 and 8.7 ± 5.7 decibels (dB) in right and left eyes, respectively. Mean sensitivity over retinal areas outside the lesion was significantly higher, 17.0 ± 3.3 and 16.7 ± 3.6 dB in right and left eyes, respectively (paired t-test, P < 0.01). Mean aggregate retinal sensitivity loss was 33.5 ± 30.4 dB (n = 40), correlating well with IS/OS lesion area (Pearson correlation coefficient = 0.848, P < 0.01).
Conclusions: "En face" OCT imaging of the IS/OS junction layer provides a functionally relevant method for assessing disease severity in type 2 MacTel.
Conflict of interest statement
Disclosure:
Figures


Similar articles
-
The IS/OS junction layer in the natural history of type 2 idiopathic macular telangiectasia.Invest Ophthalmol Vis Sci. 2012 Nov 29;53(12):7889-95. doi: 10.1167/iovs.12-10765. Invest Ophthalmol Vis Sci. 2012. PMID: 23092925 Free PMC article.
-
Retinal structural alterations and macular sensitivity in idiopathic macular telangiectasia type 1.Retina. 2012 Oct;32(9):1973-80. doi: 10.1097/IAE.0b013e318251a38b. Retina. 2012. PMID: 22487581
-
Correlation Between Macular Integrity Assessment and Optical Coherence Tomography Imaging of Ellipsoid Zone in Macular Telangiectasia Type 2.Invest Ophthalmol Vis Sci. 2017 May 1;58(6):BIO291-BIO299. doi: 10.1167/iovs.17-21834. Invest Ophthalmol Vis Sci. 2017. PMID: 28973315 Free PMC article. Clinical Trial.
-
Progression of vascular changes in macular telangiectasia type 2: comparison between SD-OCT and OCT angiography.Graefes Arch Clin Exp Ophthalmol. 2019 Jul;257(7):1381-1392. doi: 10.1007/s00417-019-04323-0. Epub 2019 May 16. Graefes Arch Clin Exp Ophthalmol. 2019. PMID: 31093765
-
Imaging endpoints for clinical trials in MacTel type 2.Eye (Lond). 2022 Feb;36(2):284-293. doi: 10.1038/s41433-021-01723-7. Epub 2021 Aug 13. Eye (Lond). 2022. PMID: 34389818 Free PMC article. Review.
Cited by
-
The IS/OS junction layer in the natural history of type 2 idiopathic macular telangiectasia.Invest Ophthalmol Vis Sci. 2012 Nov 29;53(12):7889-95. doi: 10.1167/iovs.12-10765. Invest Ophthalmol Vis Sci. 2012. PMID: 23092925 Free PMC article.
-
Quantitative analysis of photoreceptor layer reflectivity on en-face optical coherence tomography as an estimator of cone density.Graefes Arch Clin Exp Ophthalmol. 2017 Nov;255(11):2119-2126. doi: 10.1007/s00417-017-3761-3. Epub 2017 Aug 8. Graefes Arch Clin Exp Ophthalmol. 2017. PMID: 28791546
-
Progression characteristics of ellipsoid zone loss in macular telangiectasia type 2.Acta Ophthalmol. 2019 Nov;97(7):e998-e1005. doi: 10.1111/aos.14110. Epub 2019 Apr 9. Acta Ophthalmol. 2019. PMID: 30968592 Free PMC article.
-
Deep learning-based classification and segmentation of retinal cavitations on optical coherence tomography images of macular telangiectasia type 2.Br J Ophthalmol. 2022 Mar;106(3):396-402. doi: 10.1136/bjophthalmol-2020-317131. Epub 2020 Nov 23. Br J Ophthalmol. 2022. PMID: 33229343 Free PMC article.
-
Relative Ellipsoid Zone Reflectivity in Macular Telangiectasia Type 2.Invest Ophthalmol Vis Sci. 2023 Jul 3;64(10):21. doi: 10.1167/iovs.64.10.21. Invest Ophthalmol Vis Sci. 2023. PMID: 37462978 Free PMC article.
References
-
- Gass JD, Oyakawa RT. Idiopathic juxtafoveolar retinal telangiectasis. Arch Ophthalmol. 1982; 100: 769– 780. - PubMed
-
- Gaudric A, Ducos de Lahitte G, Cohen SY, Massin P, Haouchine B. Optical coherence tomography in group 2A idiopathic juxtafoveolar retinal telangiectasis. Arch Ophthalmol. 2006; 124: 1410– 1419. - PubMed
-
- Yannuzzi LA, Bardal AM, Freund KB, Chen KJ, Eandi CM, Blodi B. Idiopathic macular telangiectasia. Arch Ophthalmol. 2006; 124: 450– 460. - PubMed
-
- Maruko I, Iida T, Sekiryu T, Fujiwara T. Early morphological changes and functional abnormalities in group 2A idiopathic juxtafoveolar retinal telangiectasis using spectral domain optical coherence tomography and microperimetry. Br J Ophthalmol. 2008; 92: 1488– 1491. - PubMed
-
- Krivosic V, Tadayoni R, Massin P, Erginay A, Gaudric A. Spectral domain optical coherence tomography in type 2 idiopathic perifoveal telangiectasia. Ophthalmic Surg Lasers Imaging. 2009; 40: 379– 384. - PubMed
Publication types
MeSH terms
Grants and funding
LinkOut - more resources
Full Text Sources
Research Materials
Miscellaneous

