. 2012 Oct;139(19):3590-9.
doi: 10.1242/dev.081513. Epub 2012 Aug 16.

Centrosome movements in vivo correlate with specific neurite formation downstream of LIM homeodomain transcription factor activity

Affiliations

Centrosome movements in vivo correlate with specific neurite formation downstream of LIM homeodomain transcription factor activity

Erica F Andersen et al. Development. 2012 Oct.

Abstract

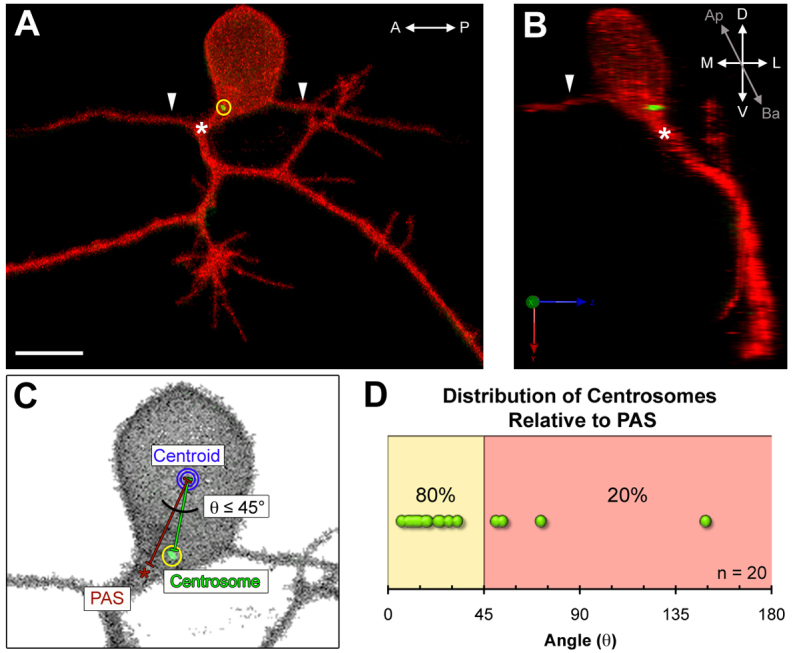
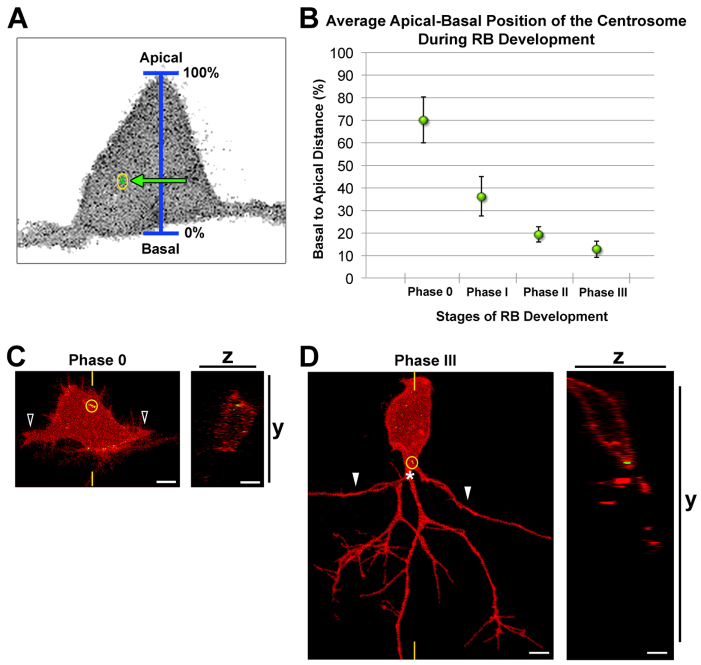
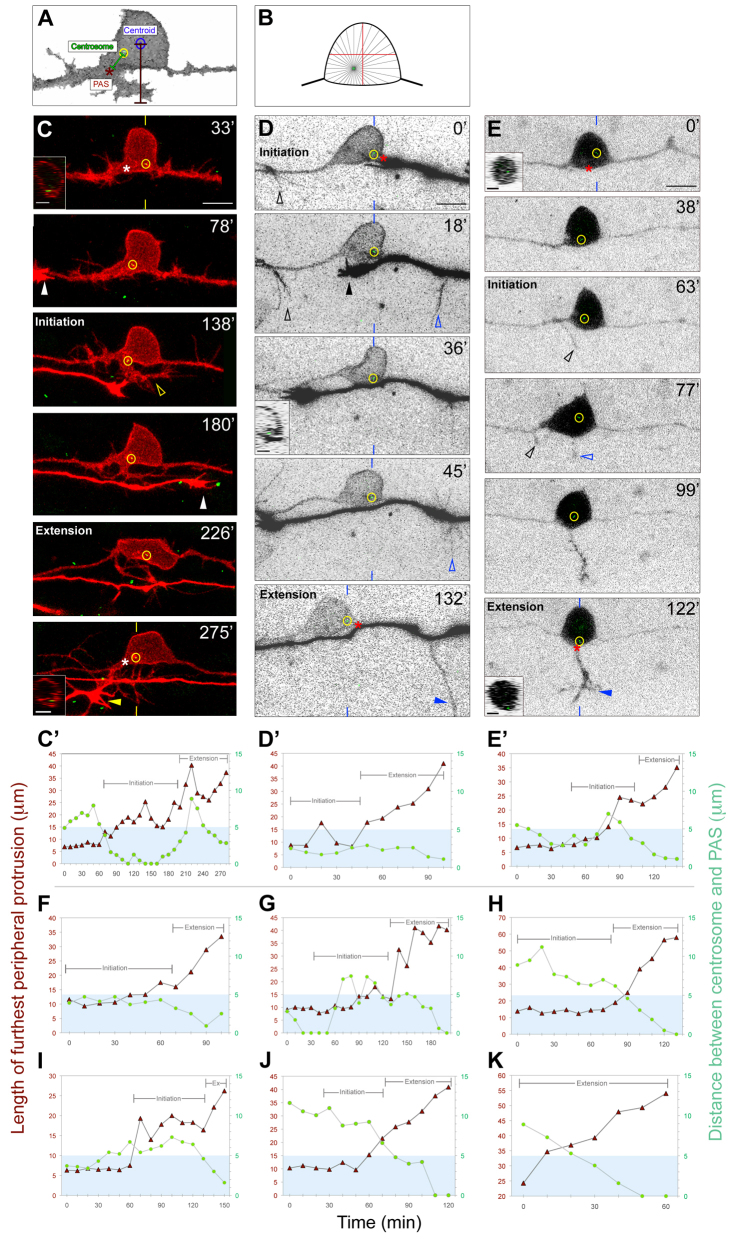
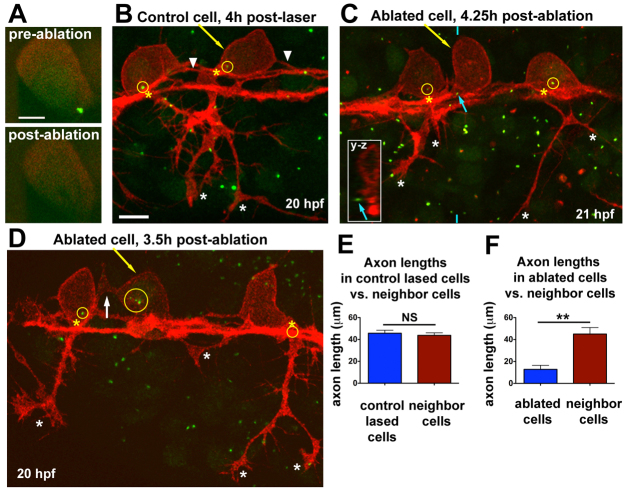
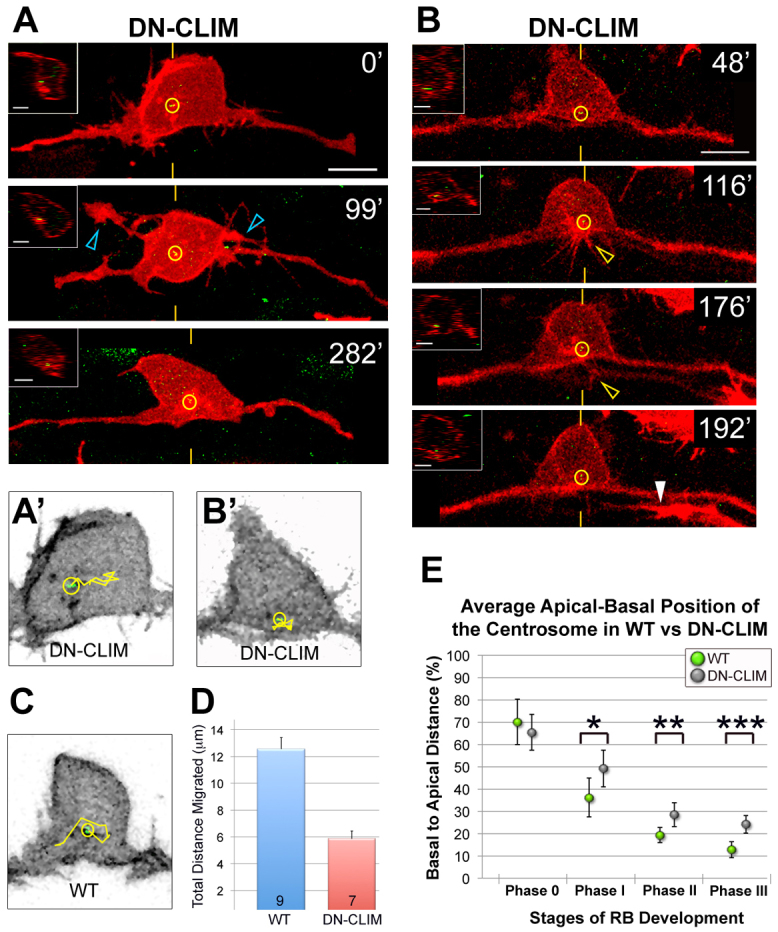
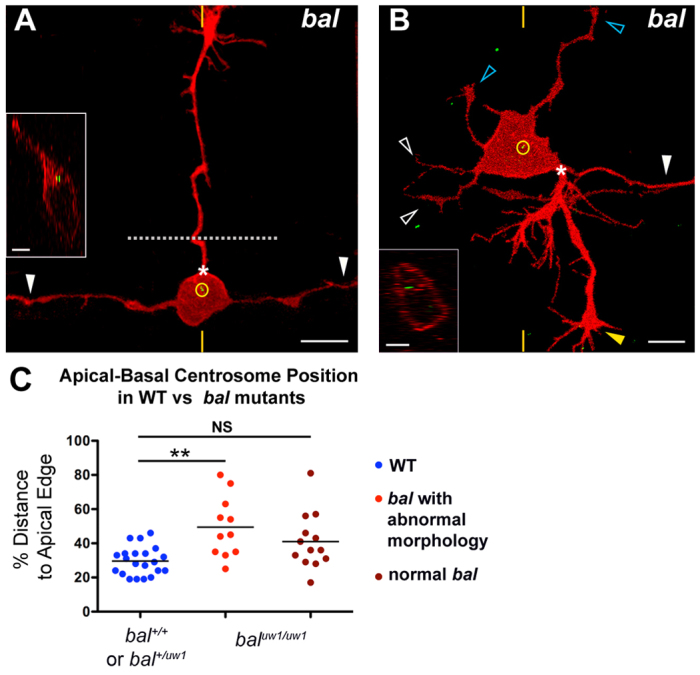
Neurons must develop complex structure to form proper connections in the nervous system. The initiation of axons in defined locations on the cell body and their extension to synaptic targets are critical steps in neuronal morphogenesis, yet the mechanisms controlling axon formation in vivo are poorly understood. The centrosome has been implicated in multiple aspects of neuronal morphogenesis; however, its function in axon development is under debate. Conflicting results from studies of centrosome function in axonogenesis suggest that its role is context dependent and underscore the importance of studying centrosome function as neurons develop in their natural environment. Using live imaging of zebrafish Rohon-Beard (RB) sensory neurons in vivo, we discovered a spatiotemporal relationship between centrosome position and the formation of RB peripheral, but not central, axons. We tested centrosome function by laser ablation and found that centrosome disruption inhibited peripheral axon outgrowth. In addition, we show that centrosome position and motility are regulated by LIM homeodomain transcription factor activity, which is specifically required for the development of RB peripheral axons. Furthermore, we show a correlation between centrosome mislocalization and ectopic axon formation in bashful (laminin alpha 1) mutants. Thus, both intrinsic transcription factor activity and extracellular cues can influence centrosome position and axon formation in vivo. This study presents the first positive association between the centrosome and axon formation in vivo and suggests that the centrosome is important for differential neurite formation in neurons with complex axonal morphologies.


Figures

Fig. 1.
Fig. 1.
The centrosome is positioned near the peripheral axon initiation site in mature Rohon-Beard neurons. (A,B) Images of a mature Rohon-Beard (RB) neuron labeled by transient expression of TagRFP-CAAX in a wild-type zebrafish embryo expressing GFP-Xcentrin mRNA. (A) z-projection showing central axons extended along the anterior-posterior (A-P) axis (arrowheads) and a branched peripheral axon orthogonal to the A-P axis. The centrosome (yellow circle) is localized near the peripheral axon initiation site (PAS, asterisk). Scale bar: 10 μm. (B) Three-dimensional rendering of the neuron in A (yz view) showing the centrosome at the basal-lateral (Ba-L) cell body surface, near the PAS. (C) Schematic showing how centrosome position (yellow circle) was measured relative to the PAS and centroid (blue circle). (D) Distribution of angle (θ) measurements defined in C. The line between the yellow and red zones indicates 45° angle cut-off.
Fig. 2.
Fig. 2.
The centrosome occupies a progressively basal position during RB development. (A) Schematic showing how centrosome position (yellow circle) was measured relative to the apical-basal axis. (B) Quantification of average centrosome position and its distribution about the mean (± 2 s.e.m.) during stages of RB development. Mean percentages are: phase 0, 70.0±10.2% (n=13); phase I, 36.1±8.6% (n=12); phase II, 19.3±3.4% (n=14); phase III, 12.7±3.6% (n=11). A total of 36 neurons were analyzed in live zebrafish embryos. (C,D) RB neurons labeled by transient expression of TagRFP-CAAX in GFP-Xcentrin mRNA-expressing wild-type embryos. Images shown are z-projections and optical cross-sections through the centrosome-containing region (indicated with yellow hatch marks). (C) Centrosome position during central axon initiation (phase 0). The open arrowheads indicate central axons. z-projection and xy view show centrosome (yellow circle) localized apically in the cell body. (D) Centrosome position during peripheral extension (phase III). White arrowheads indicate central axons. The centrosome is localized basally, near the PAS (asterisk). Scale bars: 5 μm.
Fig. 3.
Fig. 3.
The centrosome localizes near the RB PAS during axon formation. (A) Schematic showing how centrosome localization and peripheral axon length were measured for the plots in C′-E′ and F-K (see Materials and methods). (B) Diagram showing how off-center displacement of the centrosome could cause asymmetric microtubule (MT) delivery. (C-E) Individual RB neurons labeled by transient expression of either TagRFP-CAAX in GFP-Xcentrin mRNA-expressing zebrafish embryos (C,D) or of GFP-Zcentrin (E) alone. Dorsal-lateral views, anterior left. Images are z-projections of RB neuron (red or black-white inverted) overlaid with single xy planes (green) of the centrosome (yellow circles). Insets are optical cross-sections (medial is left) through the region of the cell containing the centrosome (indicated with yellow or blue hatch marks). (C′-E′,F-K) Plots of length of furthest peripheral protrusion (red triangles) and centrosome distance to PAS (green circles) versus time during peripheral axon initiation and extension (brackets). Blue box indicates region within 5 μm of the PAS. (C,C′) Time-lapse images and corresponding plot showing centrosome localization to the PAS during peripheral axon initiation (open arrowhead) and extension. Asterisks at 33′ and 275′ indicate future and formed PAS. White and yellow arrowheads at 78′ and 275′ indicate growth cones of neighboring central and peripheral axons entering the field of view. (D,D′) Time-lapse images and corresponding plot showing centrosome localization near the PAS during initiation and extension. A peripheral axon initiates off the ascending central axon (black open arrowhead), but retracts after a second peripheral initiates off the descending central axon (blue open arrowhead) and extends (blue arrowhead). Asterisks at 0′ and 132′ indicate position measured for PAS. Black arrowhead at 18′ indicates growth cone of neighboring central axon. (E,E′) Time-lapse images and corresponding plot showing centrosome localization to the PAS during peripheral axon initiation and extension. A peripheral axon initiates off the ascending central axon (black open arrowheads), but retracts after a second peripheral axon initiates off the cell body (blue open arrowhead) and extends into the periphery (blue arrowhead). Asterisks at 0′ and 122′ indicate future and formed PAS, respectively. Time is in minutes. Plots in F-K are from six additional movies. Scale bars: 10 μm; 5 μm in insets.
Fig. 4.
Fig. 4.
Centrosome ablation causes RB peripheral axon defects and ectopic protrusions. (A) Single optical section showing centrosome (labeled with GFP-Xcentrin) before and immediately after laser ablation. (B-D) z-projections of RB neurons (red) in Tg(–3.1ngn:tagrfp-caax) zebrafish embryos during phase III, overlaid with partial z-projections of GFP-Xcentrin (green) containing the z-planes spanning the cell body of interest. Yellow arrows indicate lased cells, yellow circles show centrosomes within neurons, and yellow asterisks indicate the PAS. (B) Control cell lased away from the centrosome shows normal cell morphology. White asterisks indicate peripheral axon branches of lased cell. Arrowheads indicate central axons. The central axons of neighboring cells are also in view. (C) RB neuron with ablated centrosome lacks a peripheral axon. Blue arrow indicates centrosome outside lased cell, shown in yz cross-section taken at the position of the blue hatch mark (inset). White asterisks indicate peripheral axon branches of non-lased cells. (D) RB neuron with fragmented centrosome lacks a peripheral axon. White arrow indicates an ectopic protrusion from the cell body. Peripheral axons of non-lased cells extend normally (white asterisks). The centrosome of the neuron on the right is obscured by other central axons at the PAS. (E) Mean (±s.e.m.) axon length: control-lased cells, 45.7±2.7 μm; neighbors, 43.8±2.3 μm; NS, not significant (P=0.64, paired t-test). (F) Mean axon length: ablated cells, 12.8±3.7 μm; neighbors, 45.1±5.9 μm; **P=0.0018, paired t-test. Axons from neighboring cells and control cells often extended out of the imaging field and thus their lengths are an underestimate. Control-lased and centrosome-ablated axon lengths are also significantly different from each other (P<0.0001, unpaired t-test). Scale bars: 5 μm in A; 10 μm in B-D.
Fig. 5.
Fig. 5.
Disruption of LIM-HD transcription factor activity affects centrosome motility and positioning in RB neurons. (A,B) Individual RB neurons labeled by transient expression of TagRFP-CAAX in GFP-Xcentrin mRNA- and DN-CLIM mRNA-expressing zebrafish embryos. Dorsal-lateral views, anterior left. Images are z-projections of RB neuron (red) overlaid with single xy planes of the centrosome (green). Insets are optical cross-sections (medial is left) through the centrosome region (indicated with yellow hatch marks). (A) Time-lapse images show a relatively apical centrosome position (yellow circles) (compare with wild type, Fig. 3) during ectopic apical neurite formation (blue open arrowheads). (B) Time-lapse images show a normal basal but relatively medial centrosome localization (compare with wild type, Fig. 3) in a neuron that initiates then retracts a peripheral neurite (yellow open arrowhead). White arrowhead indicates a neighboring central axon entering the field. Scale bars: 10 μm; 5 μm in insets. (A′,B′,C) Tracks (yellow lines) of centrosome movement in neurons shown in A and B (DN-CLIM) and in Fig. 3C (wild type, WT). (D) Quantification of average total distance of centrosome migration during a 2-hour period. Error bars represent s.e.m. The number of neurons (n) is indicated in each bar. P<10–4, two-tailed t-test. (E) The average centrosome position and its distribution about the mean (± 2 s.e.m.) during developmental stages. For comparison, wild-type data (Fig. 2B) are included. For DN-CLIM, mean percentages are: phase 0, 65.4±8.0% (n=14); phase I, 49.2±8.3% (n=10); phase II, 28.5±5.5% (n=20); phase III, 24.1±3.9% (n=15). A total of 42 neurons were analyzed in live embryos. *P=0.0481, **P=0.0180, ***P=0.0004, two-tailed t-test.
Fig. 6.
Fig. 6.
RB neurons have mislocalized centrosomes and aberrant morphology in bal mutant embryos. (A,B) Individual RB neurons labeled by transient expression of TagRFP-CAAX in GFP-Xcentrin mRNA-expressing bal mutant zebrafish embryos. Dorsal-lateral views, anterior left. Images are z-projections and insets are optical cross-sections through the centrosome region (indicated with yellow hatch marks). (A) Mature RB neuron in a bal embryo with normal central axons (white arrowheads) and an ectopic apical axon (PAS indicated by asterisk) that crossed the midline (dotted line) and grew to the contralateral trunk. The centrosome (yellow circle) is localized near the apical cell body edge. (B) Mature RB neuron in a bal embryo with supernumerary axons. Neuron extended a normal descending central axon (white arrowhead) and peripheral axon (yellow arrowhead) from the PAS (asterisk), but has truncated ascending central neurites (white open arrowheads) and ectopic apical neurites (blue open arrowheads). The centrosome (yellow circle) is localized halfway between the apical and basal cell surfaces. (C) Scatter plot of centrosome position. Mean ± s.e.m. for WT: 29.6±1.8 (n=21); abnormal bal, 49.5±5.4 (n=11); normal bal, 41.1±4.5. ANOVA with Tukey’s multiple comparison shows that abnormal bal is significantly different from WT (**P<0.05) and that normal bal is not significantly different (NS) from WT.

References

    1. Adler C. E., Fetter R. D., Bargmann C. I. (2006). UNC-6/Netrin induces neuronal asymmetry and defines the site of axon formation. Nat. Neurosci. 9, 511–518 - PMC - PubMed
    1. Andersen E., Asuri N., Clay M., Halloran M. (2010). Live imaging of cell motility and actin cytoskeleton of individual neurons and neural crest cells in zebrafish embryos. J. Vis. Exp. 3 1726 - PMC - PubMed
    1. Andersen E. F., Asuri N. S., Halloran M. C. (2011). In vivo imaging of cell behaviors and F-actin reveals LIM-HD transcription factor regulation of peripheral versus central sensory axon development. Neural Dev. 6, 27 - PMC - PubMed
    1. Arimura N., Kaibuchi K. (2007). Neuronal polarity: from extracellular signals to intracellular mechanisms. Nat. Rev. Neurosci. 8, 194–205 - PubMed
    1. Baas P. W., Lin S. (2011). Hooks and comets: The story of microtubule polarity orientation in the neuron. Dev. Neurobiol. 71, 403–418 - PMC - PubMed

Publication types

MeSH terms