

Spatially-resolved eigenmode decomposition of red blood cells membrane fluctuations questions the role of ATP in flickering
- PMID: 22899990
- PMCID: PMC3416845
- DOI: 10.1371/journal.pone.0040667
Spatially-resolved eigenmode decomposition of red blood cells membrane fluctuations questions the role of ATP in flickering
Abstract
Red blood cells (RBCs) present unique reversible shape deformability, essential for both function and survival, resulting notably in cell membrane fluctuations (CMF). These CMF have been subject of many studies in order to obtain a better understanding of these remarkable biomechanical membrane properties altered in some pathological states including blood diseases. In particular the discussion over the thermal or metabolic origin of the CMF has led in the past to a large number of investigations and modeling. However, the origin of the CMF is still debated. In this article, we present an analysis of the CMF of RBCs by combining digital holographic microscopy (DHM) with an orthogonal subspace decomposition of the imaging data. These subspace components can be reliably identified and quantified as the eigenmode basis of CMF that minimizes the deformation energy of the RBC structure. By fitting the observed fluctuation modes with a theoretical dynamic model, we find that the CMF are mainly governed by the bending elasticity of the membrane and that shear and tension elasticities have only a marginal influence on the membrane fluctations of the discocyte RBC. Further, our experiments show that the role of ATP as a driving force of CMF is questionable. ATP, however, seems to be required to maintain the unique biomechanical properties of the RBC membrane that lead to thermally excited CMF.
Conflict of interest statement
Figures
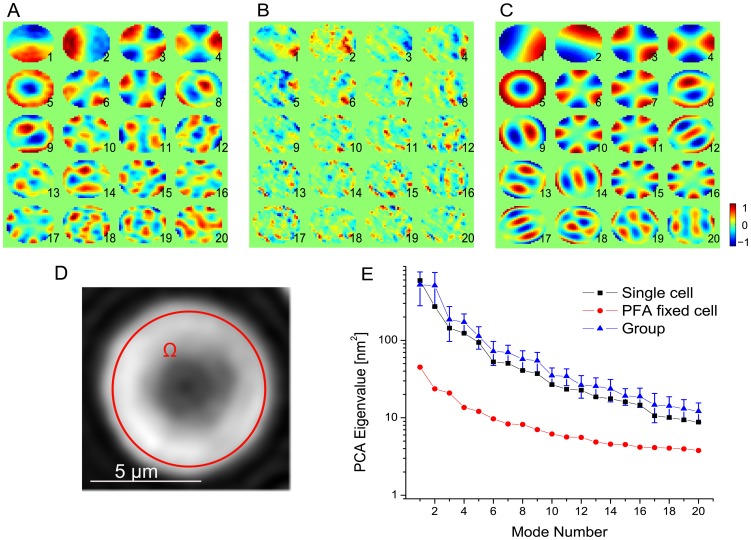
 are indicated by error bars.
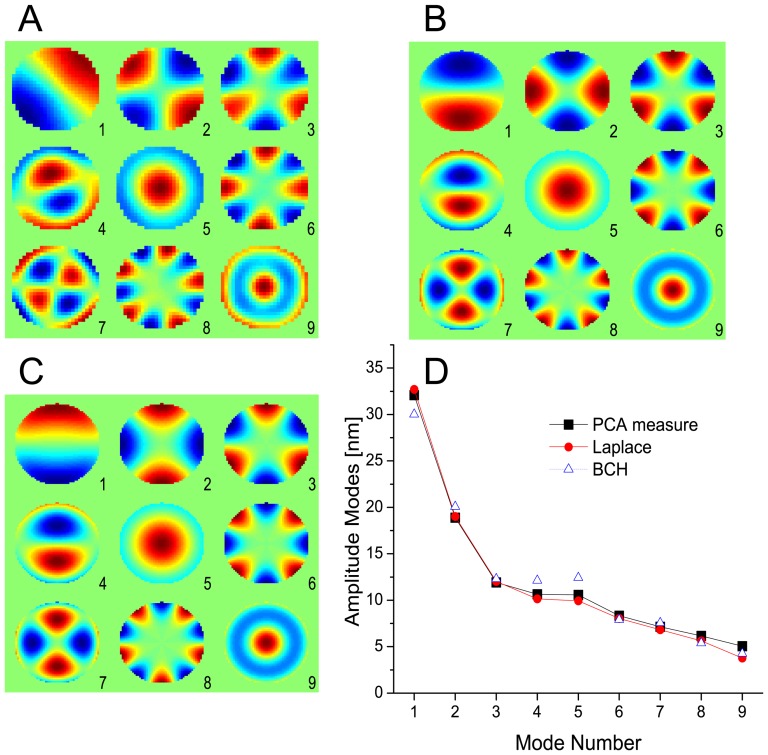
 (C) Eigenmodes that minimize BCH Deformation Energy shown only in the ROI (D) Comparison of theoretical and measured fluctuation amplitudes.
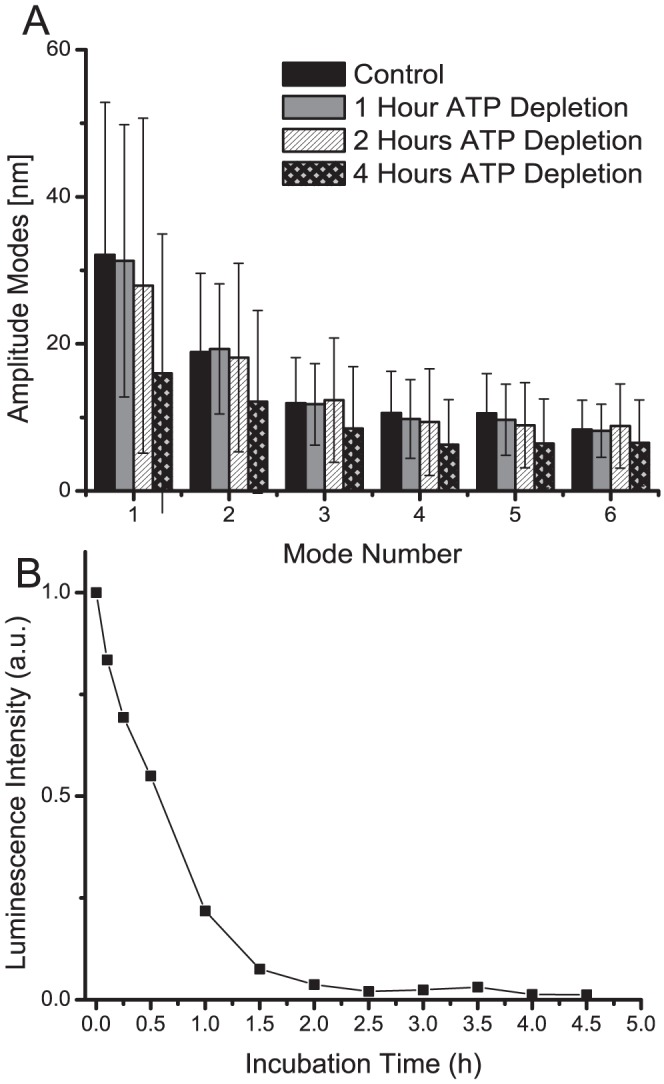
References
-
- Brochard F, Lennon JF (1975) Frequency spectrum of the flicker phenomenon in erythrocytes. J Phys France 36: 1035–1047.
-
- Zilker A, Engelhardt H, Sackmann E (1987) Dynamic reflection interference contrast (ric-) microscopy - a new method to study surface excitations of cells and to measure membrane bending elastic-moduli. Journal De Physique 48: 2139–2151.
-
- Zilker A, Ziegler M, Sackmann E (1992) Spectral analysis of erythrocyte flickering in the 0.3–4 mum-1 regime by microinterferometry combined with fast image processing. Physical Review A 46: 7998. - PubMed
-
- Gov N, Zilman AG, Safran S (2003) Cytoskeleton confinement and tension of red blood cell membranes. Physical Review Letters 90: 228101. - PubMed
Publication types
MeSH terms
Substances
LinkOut - more resources
Full Text Sources
Miscellaneous
