

Optimizing reactive responses to outbreaks of immunizing infections: balancing case management and vaccination
- PMID: 22899996
- PMCID: PMC3416818
- DOI: 10.1371/journal.pone.0041428
Optimizing reactive responses to outbreaks of immunizing infections: balancing case management and vaccination
Abstract
For vaccine-preventable infections, immunization generally needs to be supplemented by palliative care of individuals missed by the vaccination. Costs and availability of vaccine doses and palliative care vary by disease and by region. In many situations, resources for delivery of palliative care are independent of resources required for vaccination; however we also need to consider the conservative scenario where there is some trade-off between efforts, which is of potential relevance for resource-poor settings. We formulate an SEIR model that includes those two control strategies--vaccination and palliative care. We consider their relative merit and optimal allocation in the context of a highly efficacious vaccine, and under the assumption that palliative care may reduce transmission. We investigate the utility of a range of mixed or pure strategies that can be implemented after an epidemic has started, and look for rule-of-thumb principles of how best to reduce the burden of disease during an acute outbreak over a spectrum of vaccine-preventable infections. Intuitively, we expect the best strategy to initially focus on vaccination, and enhanced palliative care after the infection has peaked, but a number of plausible realistic constraints for control result in important qualifications on the intervention strategy. The time in the epidemic when one should switch strategy depends sensitively on the relative cost of vaccine to palliative care, the available budget, and R0. Crucially, outbreak response vaccination may be more effective in managing low-R0 diseases, while high R0 scenarios enhance the importance of routine vaccination and case management.
Conflict of interest statement
Figures

 ; vaccination moves individuals from the S compartment to the R compartment, both untreated (
 ) and treated (
 ) infected individuals may move into mortality compartment (D), according to their respective case fatality rates.
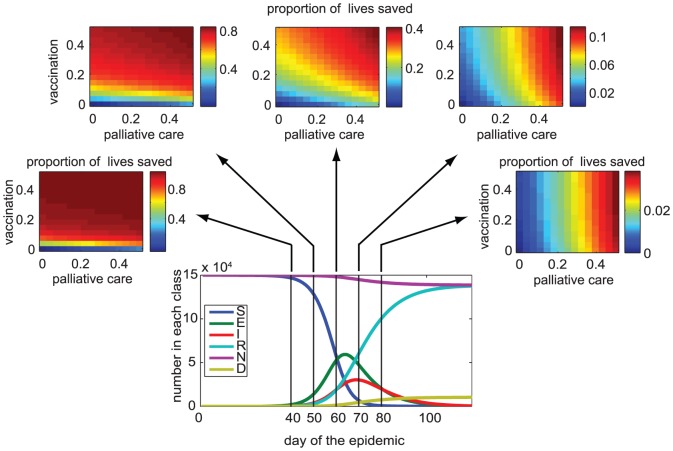
 ,
,  days,
days,  days,
days,  year−1,
  ,
,  .
.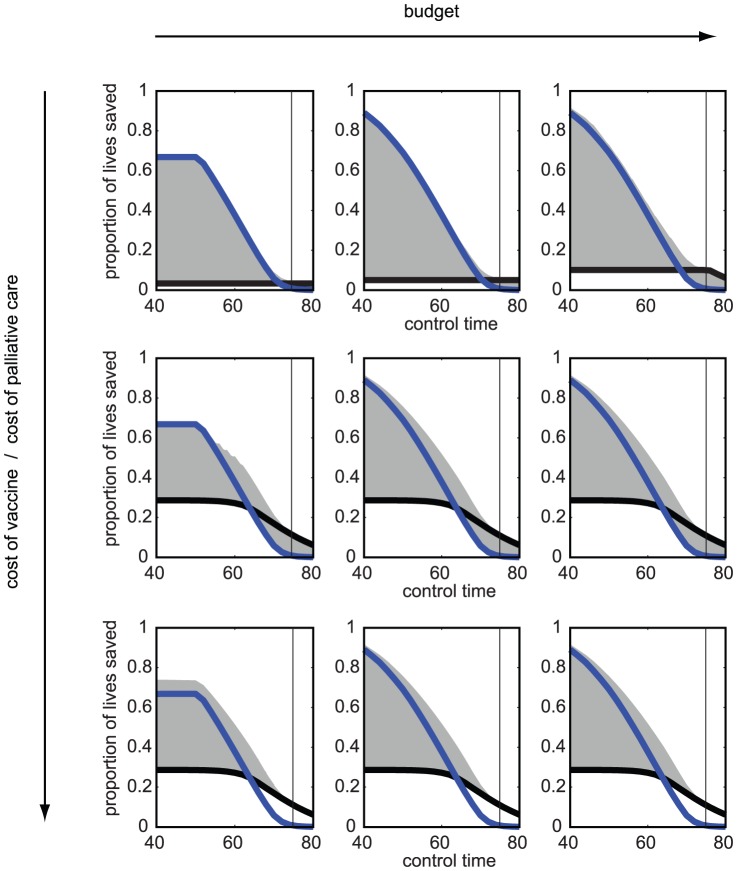
 ). Columns show increasing budget levels (from left to right:
  ,
,  ,
,  dimensionless units of cost).
  ,
,  ,
,  ,
,  days,
days,  days,
days,  days,
days,  year−1,
  ,
,  ,
,  .
.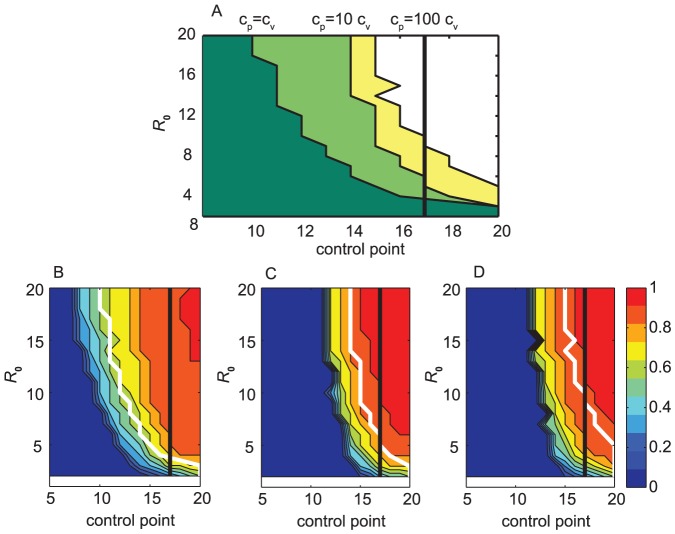
 values. (A) The time in the outbreak when the strategy should be switched from vaccine-only to a palliative-care-only strategy, for 3 ratios of costs of unit palliative care and unit vaccine: 1, 10, 100 (curves from left to right, dark green, light green, and yellow, respectively). Time is rescaled to epidemic time (in relation to the duration of the epidemic that changes with
  ) so that outbreaks for all values of
  peak along the vertical black line. (B)–(D) Best performing strategy over a range of
  values and different times of control. The colorbar shows the proportion of the budget invested in palliative care; 0 (dark blue) is vaccination-only strategy, 1 (dark red) is palliative-care-only strategy. Red colors correspond to palliative-care-intense strategies, and strategies in the blue region focus on vaccination. Time is rescaled to the epidemic so that for all
  values the epidemic peaks along the black line. The white line shows the time at which one should switch from a vaccine-only to a palliative-care-only strategy in (A). In (B) the cost of per unit palliative care (
 ) is equal to per unit cost of vaccine (
 ),
),  =
=  ; (C)
; (C)  = 10
= 10  ; (D)
; (D)  = 100
= 100  . Limited budget (100000 cost units). Outbreak alert threshold is set to 10 cases. Parameters:
  ,
,  and
and  are varied according to
  such that
  ,
,  days,
days,  days,
days,  days,
days,  year−1,
  ,
,  ,
,  .
.Similar articles
-
Comparing alternative cholera vaccination strategies in Maela refugee camp: using a transmission model in public health practice.BMC Infect Dis. 2019 Dec 21;19(1):1075. doi: 10.1186/s12879-019-4688-6. BMC Infect Dis. 2019. PMID: 31864298 Free PMC article.
-
Optimizing Real-Time Vaccine Allocation in a Stochastic SIR Model.PLoS One. 2016 Apr 4;11(4):e0152950. doi: 10.1371/journal.pone.0152950. eCollection 2016. PLoS One. 2016. PMID: 27043931 Free PMC article.
-
What should vaccine developers ask? Simulation of the effectiveness of malaria vaccines.PLoS One. 2008 Sep 11;3(9):e3193. doi: 10.1371/journal.pone.0003193. PLoS One. 2008. PMID: 18784833 Free PMC article.
-
Mass vaccination: when and why.Curr Top Microbiol Immunol. 2006;304:1-16. doi: 10.1007/3-540-36583-4_1. Curr Top Microbiol Immunol. 2006. PMID: 16989261 Review.
-
Is the absence or intermittent YF vaccination the major contributor to its persistent outbreaks in eastern Africa?Biochem Biophys Res Commun. 2017 Oct 28;492(4):548-557. doi: 10.1016/j.bbrc.2017.01.079. Epub 2017 Jan 18. Biochem Biophys Res Commun. 2017. PMID: 28109882 Review.
Cited by
-
Outbreak response intervention models of vaccine-preventable diseases in humans and foot-and-mouth disease in livestock: a protocol for a systematic review.BMJ Open. 2020 Oct 5;10(10):e036172. doi: 10.1136/bmjopen-2019-036172. BMJ Open. 2020. PMID: 33020081 Free PMC article.
-
A universal model for predicting dynamics of the epidemics caused by special pathogens.Biomed Res Int. 2013;2013:467078. doi: 10.1155/2013/467078. Epub 2013 Jul 24. Biomed Res Int. 2013. PMID: 23998125 Free PMC article.
-
Impact on Epidemic Measles of Vaccination Campaigns Triggered by Disease Outbreaks or Serosurveys: A Modeling Study.PLoS Med. 2016 Oct 11;13(10):e1002144. doi: 10.1371/journal.pmed.1002144. eCollection 2016 Oct. PLoS Med. 2016. PMID: 27727285 Free PMC article.
-
Experience implementing a university-based mass immunization program in response to a meningococcal B outbreak.Hum Vaccin Immunother. 2019;15(3):717-724. doi: 10.1080/21645515.2018.1547606. Epub 2019 Jan 8. Hum Vaccin Immunother. 2019. PMID: 30462563 Free PMC article.
-
Essential information: Uncertainty and optimal control of Ebola outbreaks.Proc Natl Acad Sci U S A. 2017 May 30;114(22):5659-5664. doi: 10.1073/pnas.1617482114. Epub 2017 May 15. Proc Natl Acad Sci U S A. 2017. PMID: 28507121 Free PMC article.
References
-
- Anderson RM, May RM (1991) Infectious diseases of Humans. Oxford: Oxford University Press.
-
- Tildesley M, Savill N, Shaw D, Deardon R, Brooks S, et al. (2006) Optimal reactive vaccination strategies for a foot-and-mouth outbreak in the UK. Nature 440: 83–86. - PubMed
-
- Grais R, Ferrari M, Dubray C, Bjørnstad O, Grenfell B, et al. (2006) Estimating transmission intensity for a measles epidemic in Niamey, Niger: lessons for intervention. T Roy Soc Trop Med Hyg 100: 867–873. - PubMed
Publication types
MeSH terms
Grants and funding
LinkOut - more resources
Full Text Sources
