

Conservation of gene cassettes among diverse viruses of the human gut
- PMID: 22900013
- PMCID: PMC3416800
- DOI: 10.1371/journal.pone.0042342
Conservation of gene cassettes among diverse viruses of the human gut
Abstract
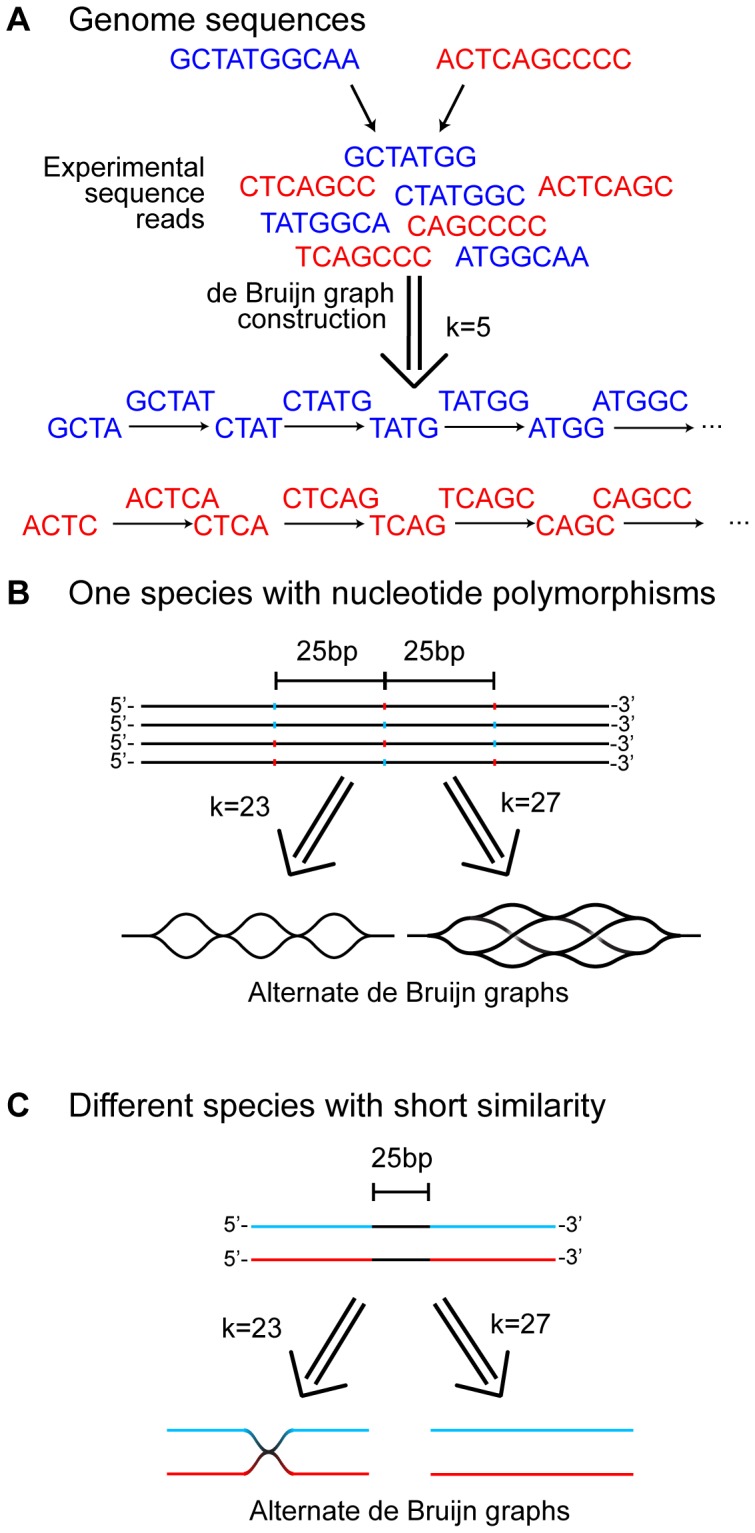
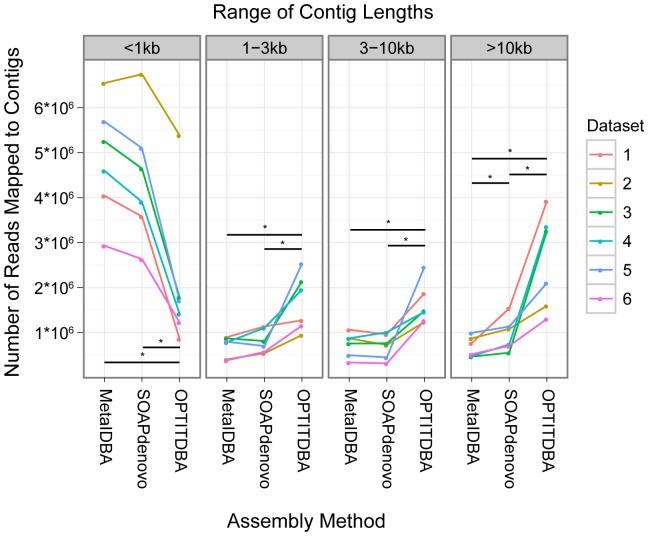
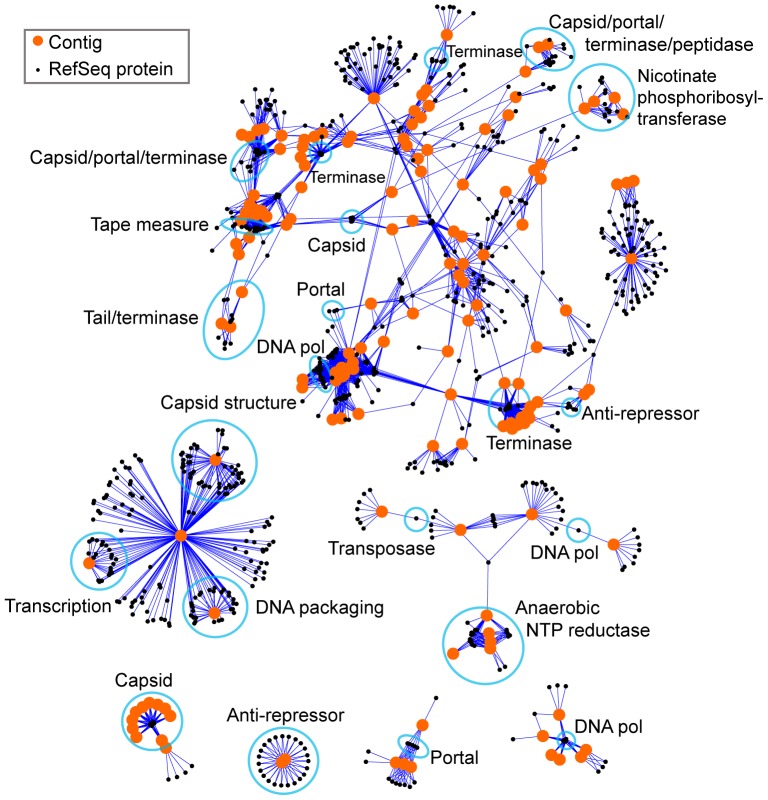
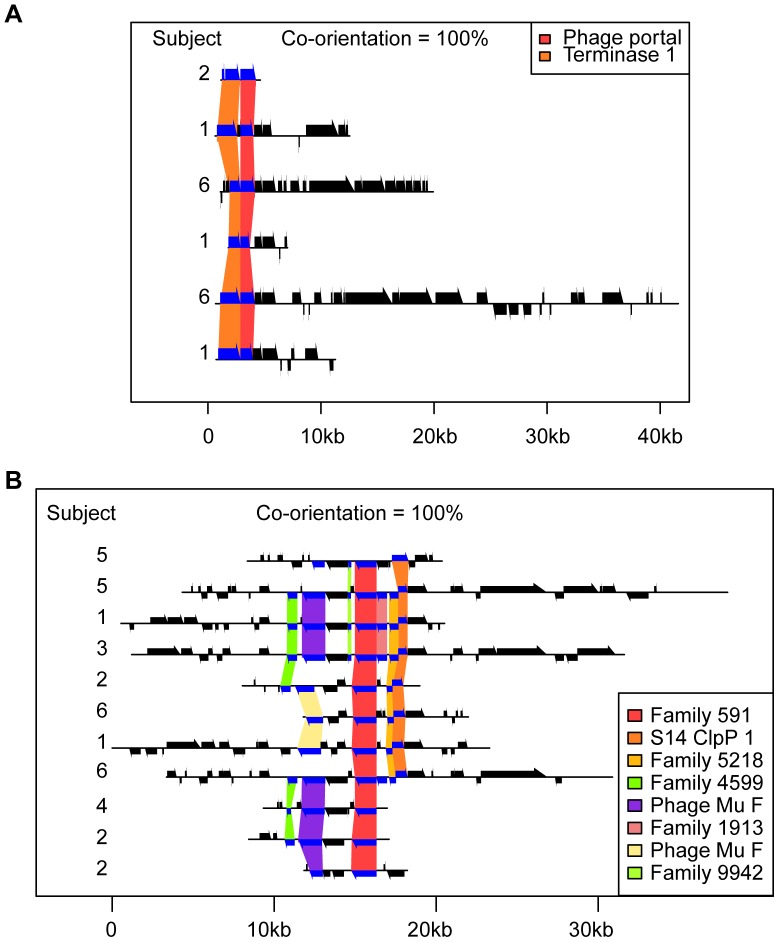
Viruses are a crucial component of the human microbiome, but large population sizes, high sequence diversity, and high frequencies of novel genes have hindered genomic analysis by high-throughput sequencing. Here we investigate approaches to metagenomic assembly to probe genome structure in a sample of 5.6 Gb of gut viral DNA sequence from six individuals. Tests showed that a new pipeline based on DeBruijn graph assembly yielded longer contigs that were able to recruit more reads than the equivalent non-optimized, single-pass approach. To characterize gene content, the database of viral RefSeq proteins was compared to the assembled viral contigs, generating a bipartite graph with functional cassettes linking together viral contigs, which revealed a high degree of connectivity between diverse genomes involving multiple genes of the same functional class. In a second step, open reading frames were grouped by their co-occurrence on contigs in a database-independent manner, revealing conserved cassettes of co-oriented ORFs. These methods reveal that free-living bacteriophages, while usually dissimilar at the nucleotide level, often have significant similarity at the level of encoded amino acid motifs, gene order, and gene orientation. These findings thus connect contemporary metagenomic analysis with classical studies of bacteriophage genomic cassettes. Software is available at https://sourceforge.net/projects/optitdba/.
Conflict of interest statement
Figures
Similar articles
-
Comparative analysis of CRISPR cassettes from the human gut metagenomic contigs.BMC Genomics. 2014 Mar 17;15(1):202. doi: 10.1186/1471-2164-15-202. BMC Genomics. 2014. PMID: 24628983 Free PMC article.
-
Comparison of different assembly and annotation tools on analysis of simulated viral metagenomic communities in the gut.BMC Genomics. 2014 Jan 18;15:37. doi: 10.1186/1471-2164-15-37. BMC Genomics. 2014. PMID: 24438450 Free PMC article.
-
VirFinder: a novel k-mer based tool for identifying viral sequences from assembled metagenomic data.Microbiome. 2017 Jul 6;5(1):69. doi: 10.1186/s40168-017-0283-5. Microbiome. 2017. PMID: 28683828 Free PMC article.
-
A metagenomic insight into our gut's microbiome.Gut. 2013 Jan;62(1):146-58. doi: 10.1136/gutjnl-2011-301805. Epub 2012 Apr 23. Gut. 2013. PMID: 22525886 Review.
-
Inference of functional properties from large-scale analysis of enzyme superfamilies.J Biol Chem. 2012 Jan 2;287(1):35-42. doi: 10.1074/jbc.R111.283408. Epub 2011 Nov 8. J Biol Chem. 2012. PMID: 22069325 Free PMC article. Review.
Cited by
-
Transfer of Viral Communities between Human Individuals during Fecal Microbiota Transplantation.mBio. 2016 Mar 29;7(2):e00322. doi: 10.1128/mBio.00322-16. mBio. 2016. PMID: 27025251 Free PMC article.
-
Gut Bacteriophage: Current Understanding and Challenges.Front Endocrinol (Lausanne). 2019 Nov 29;10:784. doi: 10.3389/fendo.2019.00784. eCollection 2019. Front Endocrinol (Lausanne). 2019. PMID: 31849833 Free PMC article. Review.
-
Optimizing protocols for extraction of bacteriophages prior to metagenomic analyses of phage communities in the human gut.Microbiome. 2015 Nov 17;3:64. doi: 10.1186/s40168-015-0131-4. Microbiome. 2015. PMID: 26577924 Free PMC article.
-
Movers and shakers: influence of bacteriophages in shaping the mammalian gut microbiota.Gut Microbes. 2013 Jan-Feb;4(1):4-16. doi: 10.4161/gmic.22371. Epub 2012 Sep 28. Gut Microbes. 2013. PMID: 23022738 Free PMC article. Review.
-
Genomic characteristics and environmental distributions of the uncultivated Far-T4 phages.Front Microbiol. 2015 Mar 16;6:199. doi: 10.3389/fmicb.2015.00199. eCollection 2015. Front Microbiol. 2015. PMID: 25852662 Free PMC article.
References
Publication types
MeSH terms
Substances
Grants and funding
LinkOut - more resources
Full Text Sources
