Clinical Trial
. 2012:2012:973927.
doi: 10.1155/2012/973927. Epub 2012 Jul 26.

Assessment of a standardized ROS production profile in humans by electron paramagnetic resonance

Affiliations
Clinical Trial

Assessment of a standardized ROS production profile in humans by electron paramagnetic resonance

Simona Mrakic-Sposta et al. Oxid Med Cell Longev. 2012.

Abstract

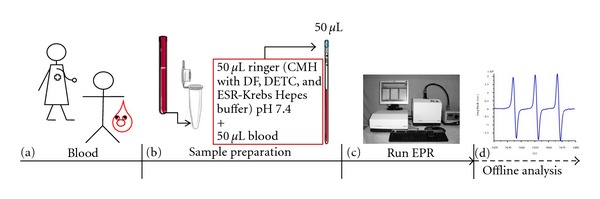
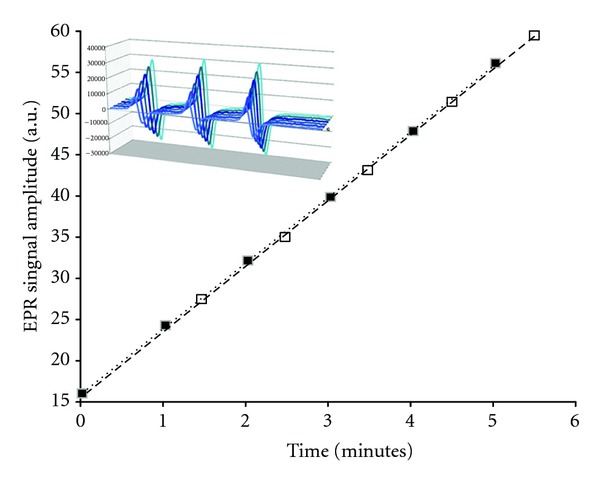
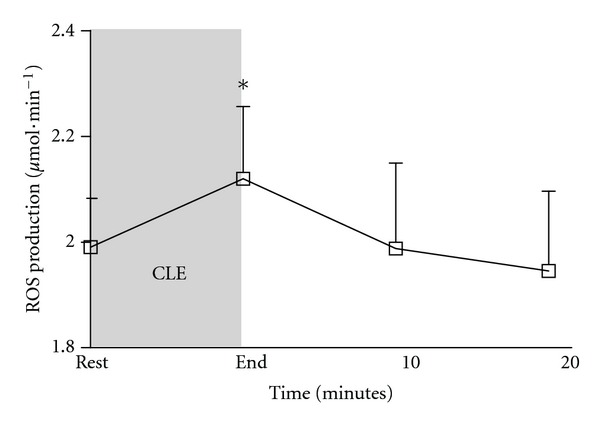
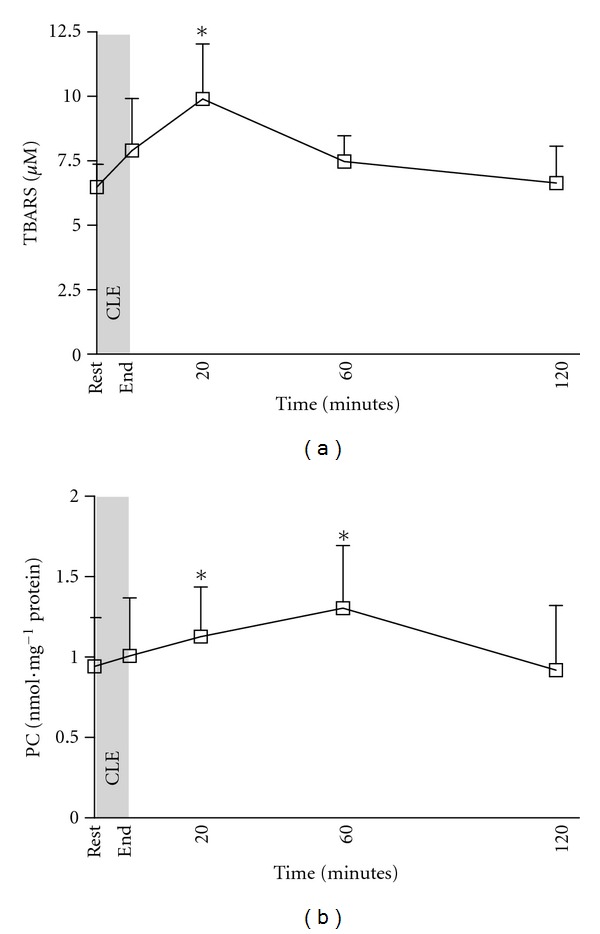
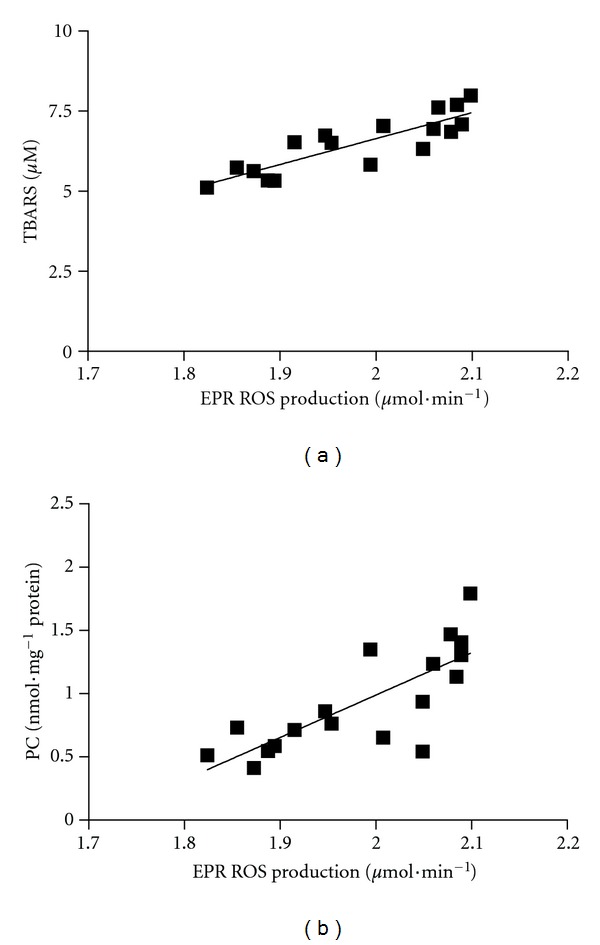
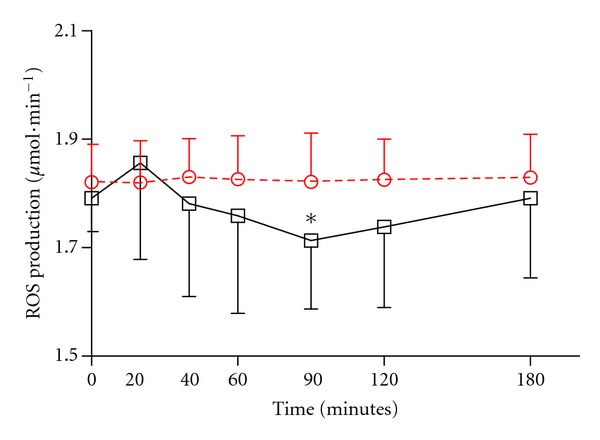
Despite the growing interest in the role of reactive oxygen species (ROS) in health and disease, reliable quantitative noninvasive methods for the assessment of oxidative stress in humans are still lacking. EPR technique, coupled to a specific spin probe (CMH: 1-hydroxy-3-methoxycarbonyl-2,2,5,5-tetramethylpyrrolidine) is here presented as the method of choice to gain a direct measurement of ROS in biological fluids and tissues. The study aimed at demonstrating that, differently from currently available "a posteriori" assays of ROS-induced damage by means of biomolecules (e.g., proteins and lipids) spin-trapping EPR provides direct evidence of the "instantaneous" presence of radical species in the sample and, as signal areas are proportional to the number of excited electron spins, lead to absolute concentration levels. Using a recently developed bench top continuous wave system (e-scan EPR scanner, Bruker) dealing with very low ROS concentration levels in small (50 μL) samples, we successfully monitored rapid ROS production changes in peripheral blood of athletes after controlled exercise and sedentary subjects after antioxidant supplementation. The correlation between EPR results and data obtained by various enzymatic assays (e.g., protein carbonyls and thiobarbituric acid reactive substances) was determined too. Synthetically, our method allows reliable, quick, noninvasive quantitative determination of ROS in human peripheral blood.


Figures

Figure 1
Figure 1
Step by step sketch of the EPR experimental protocol adopted to measure the ROS production by EPR.
Figure 2
Figure 2
The high reproducibility of the EPR measurements is well demonstrated by the plots displayed in the figure showing the calculated EPR signal levels versus the elapsed time. Two tests were performed from a healthy subject taking 6 hours from each other. The best fitting straight lines (R 2 = 0.99) were found almost superimposable: about the 0.5% discrepancy in the ROS absolute production rate (μmol · min−1) was calculated between the measurements. The stacked plot of the recorded EPR spectra during a single experiment is displayed at the upper left corner. The spectra are centered at g = 1.997. For each spectrum, the greatest signal amplitude difference in the triplet (arbitrary units) is returned by the acquisition routine, resulting in a point of the displayed graph. The ROS production rate (arbitrary units) is estimated by the best fitting line. It can be, in turn, converted in the absolute ROS production rate level (μmol · min−1) throughout the acquisition of a stable radical compound like CP.
Figure 3
Figure 3
Time course of ROS production rate detected by EPR technique before (REST), immediately after the CLE (END) and at 10 and 20 min of recovery. Results are expressed as mean ± SD. Changes over time were significant at P < 0.05 immediately post CLE compared to rest (*symbol).
Figure 4
Figure 4
Time course of thiobarbituric acid reactive substances (a) and protein carbonyls (b) concentration before (REST), immediately after the CLE (END) and at 20 min, 1, and 2 hours of recovery. Results are expressed as means ± SD. Changes over time were significant at P < 0.05 compared to rest (*symbol).
Figure 5
Figure 5
TBARS (a) and protein carbonyl PC (b) content as determined by enzymatic assays methods versus the ROS production rate (μmol · min−1) calculated by EPR data (solid symbols). The linear regression lines (solid lines) are reported. The variance analysis (Pearson product-moment correlation) indicated a positive association for both TBARS and PC (R 2 values = 0.74 and 0.60, P < 0.05, resp.).
Figure 6
Figure 6
Time course of ROS production rate (μmol · min−1) calculated by the EPR acquisition data without supplementation (red circle) and following antioxidant (R-thioctic acid) supply (black square). Results are expressed as mean ± SD. Changes over time resulted significant (P < 0.01) at 90 min post, compared to pre-supplementation (*symbol).

References

    1. Gille L, Nohl H. The ubiquinol/bc1 redox couple regulates mitochondrial oxygen radical formation. Archives of Biochemistry and Biophysics. 2001;388(1):34–38. - PubMed
    1. Powers SK, Jackson MJ. Exercise-induced oxidative stress: cellular mechanisms and impact on muscle force production. Physiological Reviews. 2008;88(4):1243–1276. - PMC - PubMed
    1. Holley AE, Cheeseman KH. Measuring free radical reactions in vivo . British Medical Bulletin. 1993;49(3):494–505. - PubMed
    1. Kohen R, Nyska A. Oxidation of biological systems: oxidative stress phenomena, antioxidants, redox reactions, and methods for their quantification. Toxicologic Pathology. 2002;30(6):620–650. - PubMed
    1. Buettner GR, Jurkiewicz BA. Ascorbate free radical as a marker of oxidative stress: an EPR study. Free Radical Biology and Medicine. 1993;14(1):49–55. - PubMed

Publication types

MeSH terms