. 2012:2012:170426.
doi: 10.1155/2012/170426. Epub 2012 Aug 1.

Administration of Recombinant Heat Shock Protein 70 Delays Peripheral Muscle Denervation in the SOD1(G93A) Mouse Model of Amyotrophic Lateral Sclerosis

Affiliations

Administration of Recombinant Heat Shock Protein 70 Delays Peripheral Muscle Denervation in the SOD1(G93A) Mouse Model of Amyotrophic Lateral Sclerosis

David J Gifondorwa et al. Neurol Res Int. 2012.

Abstract

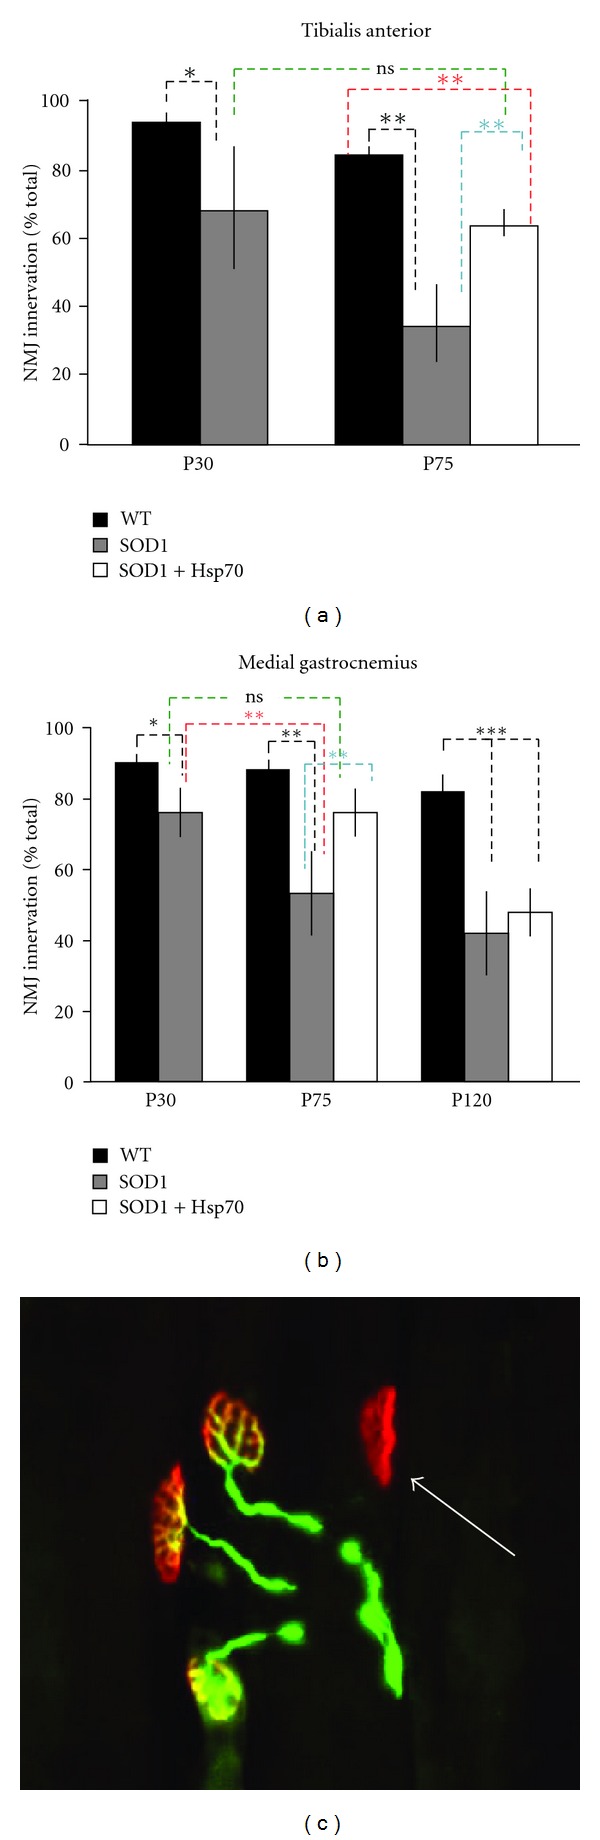
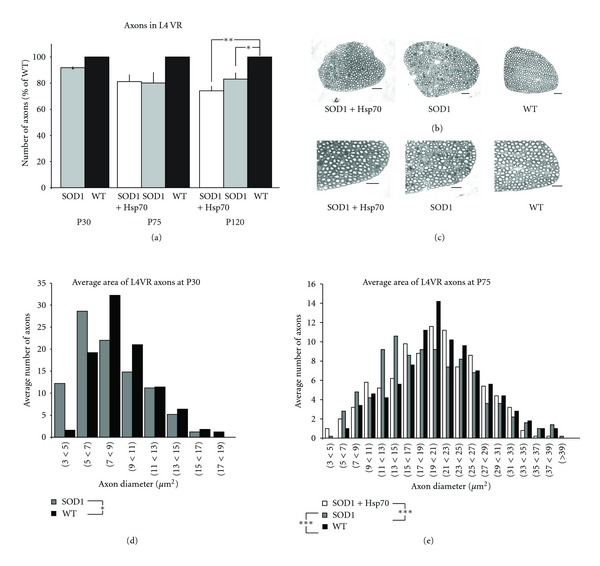
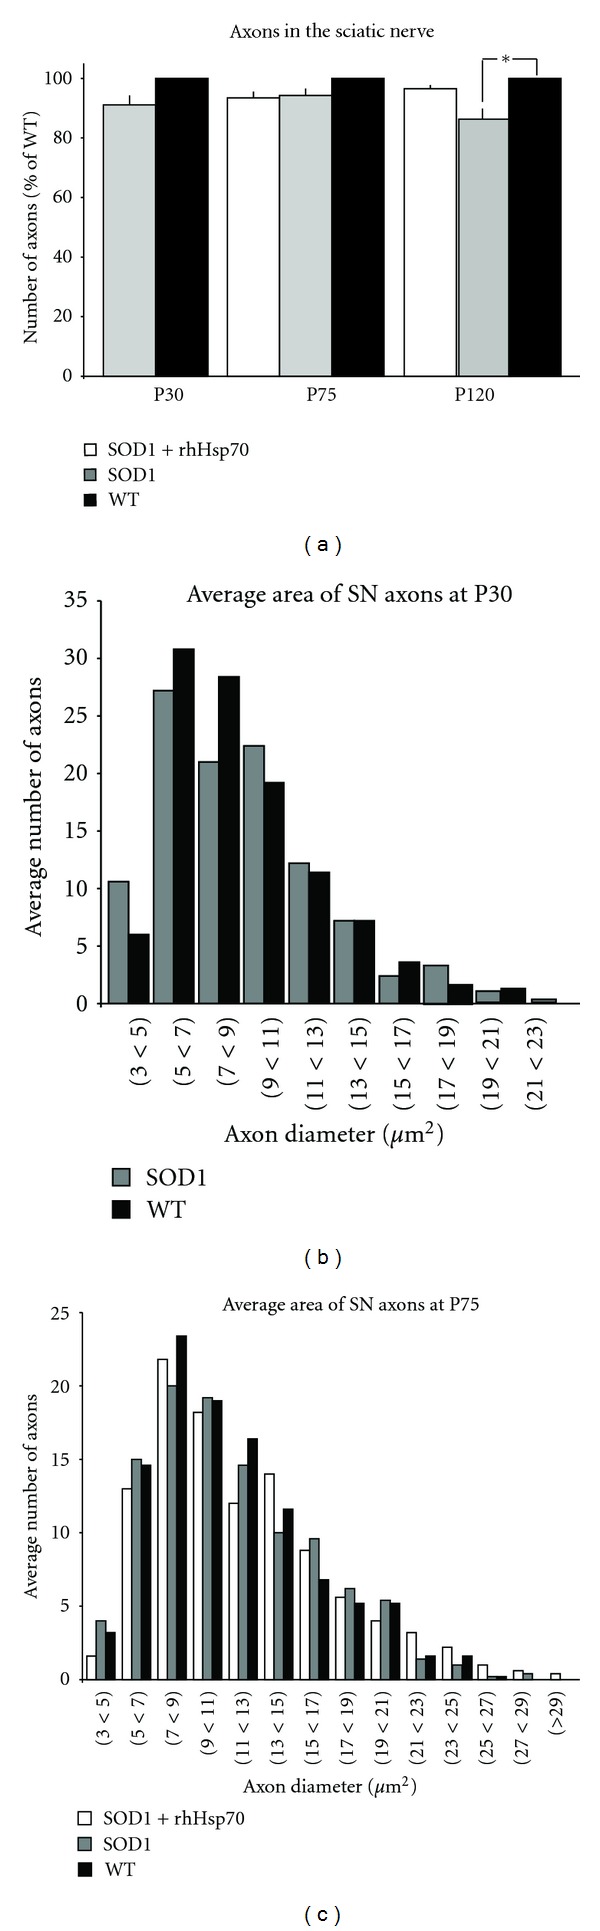
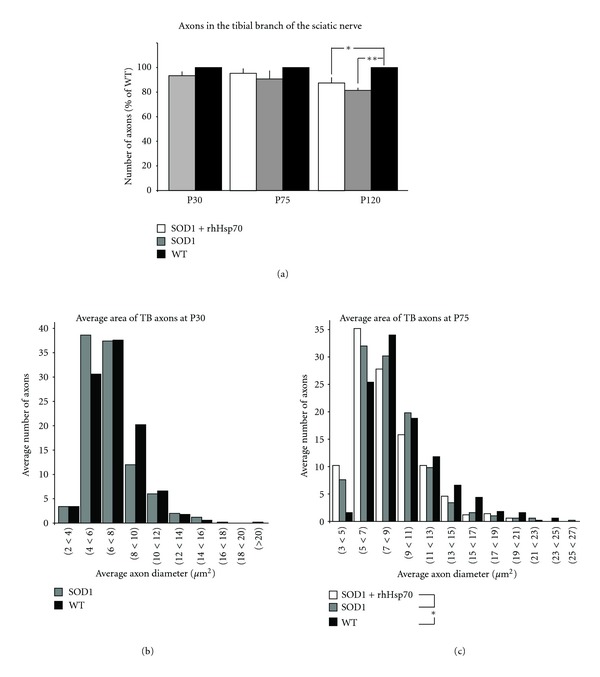
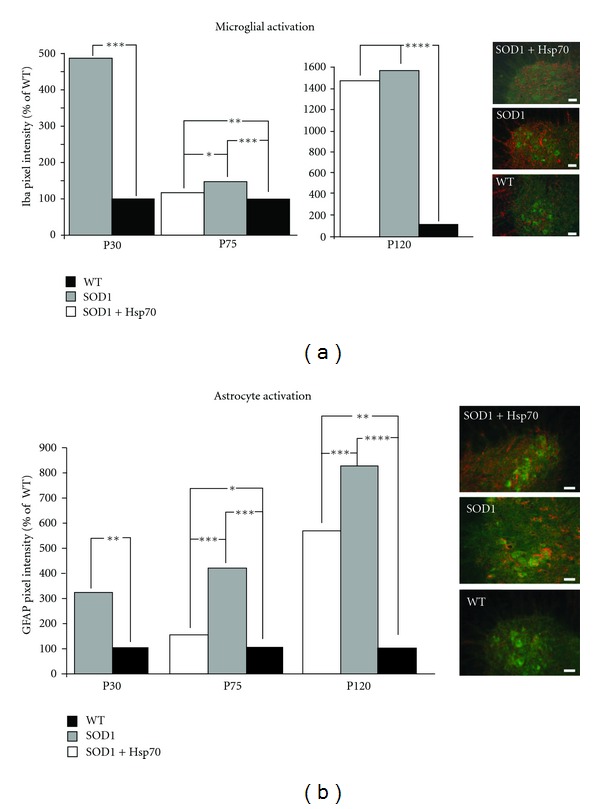
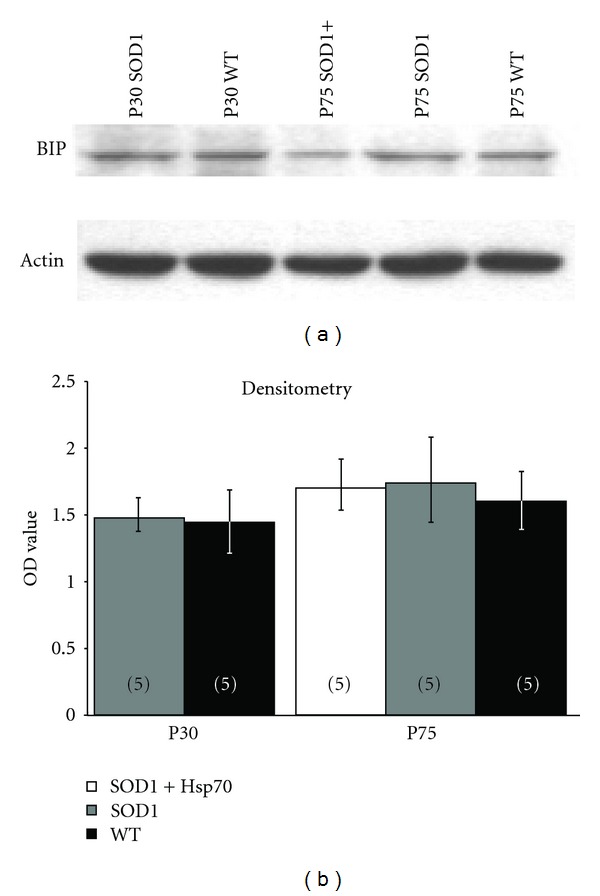
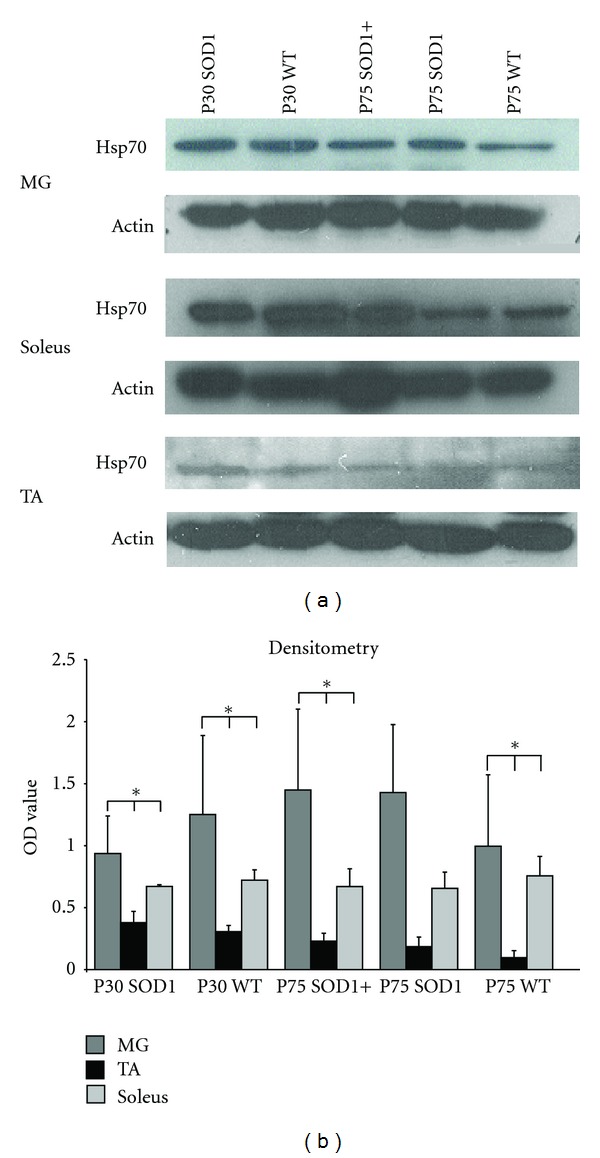
A prominent clinical feature of ALS is muscle weakness due to dysfunction, denervation and degeneration of motoneurons (MNs). While MN degeneration is a late stage event in the ALS mouse model, muscle denervation occurs significantly earlier in the disease. Strategies to prevent this early denervation may improve quality of life by maintaining muscle control and slowing disease progression. The precise cause of MN dysfunction and denervation is not known, but several mechanisms have been proposed that involve potentially toxic intra- and extracellular changes. Many cells confront these changes by mounting a stress response that includes increased expression of heat shock protein 70 (Hsp70). MNs do not upregulate Hsp70, and this may result in a potentially increased vulnerability. We previously reported that recombinant human hsp70 (rhHsp70) injections delayed symptom onset and increased lifespan in SOD1(G93A) mice. The exogenous rhHsp70 was localized to the muscle and not to spinal cord or brain suggesting it modulates peripheral pathophysiology. In the current study, we focused on earlier administration of Hsp70 and its effect on initial muscle denervation. Injections of the protein appeared to arrest denervation with preserved large myelinated peripheral axons, and reduced glial activation.


Figures

Figure 1
Figure 1
rhHsp70 injections maintain NMJ innervation. (a) Denervation of TA NMJs in SOD1 is evident by P30 and is further increased by P75. Treatment with rhHsp70 appeared to attenuate this denervation. Data are represented as percent of WT ± SEM at each time point. Statistical significance was determined by running an ANOVA, followed by the Tukey-Kramer multiple comparisons posthoc test (*P < 0.05; **P ≤ 0.01 and ***P ≤ 0.001). (b) The MG in SOD1 mice displayed significant denervation at P30 and there is further denervation at P75 as compared to WT mice. rhHsp70 treatment maintained innervation of MG NMJs between P30 and P75. Statistical analysis was performed as described in (a) P30 WT TA n = 9; P30 SOD1 TA n = 8; all other groups n = 5. (c) Photomicrograph to illustrate criteria for innervated and denervated NMJs at P75. Colocalization of αBTX-labelled nAChR clusters (red) with VAChT and neurofilament-L nerve terminals (green) indicate innervated NMJs. The arrow denotes a denervated NMJ because of the lack of VAChT labeling.
Figure 2
Figure 2
rhHsp70 injections preserve larger axons in the L4VR. (a) There was no difference in the overall number of myelinated axons in the 4th lumbar ventral root at P30 or P75 although there appears to be a trend toward decreased numbers in the SOD1 groups at P75. Data are represented as percent of WT ± SEM at each time point. N = 5 for each group. Statistical significance was determined by running an ANOVA, followed by the Tukey-Kramer multiple comparisons post-hoc test. (b) Although there was not a significant difference in the number of axons in treated and untreated mice, photomicrographs suggest that disease morphology of myelinated axons has progressed more in untreated mice as compared to treated animals. Photomicrographs of myelinated axons were taken at 40x. Scale bars = 40 μm. (c) Enlargements of photomicrographs of myelinated axons taken at 40x. Scale bars = 40 μm. (d) Size profiles of the axon area revealed a greater number of larger axons in WT animals (*P < 0.05). Data are representative histograms of the average area of myelinated axons in the L4VR of SOD1-untreated and WT mice at P30. Statistical significance was determined by running a two-way ANOVA. Axons were traced using a camera lucida at 40x scanned and average axon area was determined using Scion Image software. Data are represented as the average number of axons per area range. N = 5 for each group. (e) There were a greater number of larger axons in SOD1-treated and WT animals as compared to SOD1-untreated mice (***P < 0.001) at P75. There was no significant difference in the number of larger axons between SOD1-treated and WT animals. Data are representative histograms of the average number of axons per area range. N = 5 for each group at P75. Statistical significance was determined using repeated measures (mixed model) ANOVA. Statistical significance was determined using repeated measures (mixed model) ANOVA.
Figure 3
Figure 3
There is no change in number or size of axons in sciatic nerve with rhHsp70 treatment. (a) There was no difference in the overall number of myelinated axons in the sciatic nerve at P30 or P75. Data are represented as percent of WT ± SEM at each time point; n = 5 for each group. Statistical significance was determined as previously described. (b) Size profiles of the axon area done at P30 revealed there was no difference in the number of larger axons in SOD1 mice. Axon area and statistical significance were determined as previously described. (c) Data are representative histograms of the average area of myelinated axons in the sciatic nerve of each group at P75. There was not a significant difference in average area number of axons between the groups at this age. Axon area and statistical significance were determined as previously described.
Figure 4
Figure 4
rhHsp70 slows axon atrophy in the tibial branch of the sciatic nerve. (a) There was no difference in the overall number of myelinated axons in the tibial branch of the sciatic nerve at P30 or P75. Data are represented as percent of WT ± SEM at each time point; n = 5 each group. Statistical significance was determined as previously described. (b) Size profiles of the axon area at P30 revealed that there are comparable numbers of larger myelinated axons between WT and SOD1-untreated animals. Axon area and statistical significance were determined as previously described. (c) Axon area analysis determined that only WT animals had a greater number of larger myelinated axons in the tibial branch of the sciatic nerve at P75 (*P ≤ 0.05). Axon area and statistical significance were determined as previously described. Axon area was determined as previously described.
Figure 5
Figure 5
rhHsp70 injections attenuate early glial cell activation. (a) The fluorescent pixel intensity of Iba1 staining for microglia was increased in the SOD1 versus WT animals at P30 and P75. Treatment with rhHsp70 appeared to reduce the expression of Iba1 at P75, but the levels were greater than WT animals. Pixel intensity was measured using Image J software. Each fluorescent pixel in the section was measured and the values were compiled and averaged across each treatment group. Histograms represent the average number of pixels in a given range of arbitrary intensity units presented as % WT. Statistical significance was determined using a two-way ANOVA at P30 and a repeated measure (mixed model) ANOVA at P75 on all of the measured values above baseline (***P ≤ 0.001; **P ≤ 0.01; *P ≤ 0.05). N = 4 for each group. Images of the lateral motor column of P75 mice that were treated with Hsp70, untreated, or WT are shown on the right. 30 μm spinal cord sections were stained with Iba-1 (red) and ChAT (green). Scale bars = 20 μm. (b) GFAP expression was the greatest in SOD1 animals as compared to WT at P30 and P75. Treatment with rhHsp70 substantially reduced the expression of GFAP in SOD1 animals. Quantification of fluorescence and statistical analysis was performed as described above. Images of the ventral horn of P75 mice that were treated with Hsp70, untreated, or WT are shown on the right. 30 μm spinal cord sections were stained with GFAP (red) and ChAT (green). Scale bars = 20 μm.
Figure 6
Figure 6
Treatment with rhHsp70 has no effect on ER stress in the spinal cord as determined by BiP expression. (a) Protein extracts were collected from individual lumbar spinal cords and subjected to electrophoresis on a 12% SDS PAGE gel. Proteins were transferred to Immobilon-P membrane, blocked in TBS-T, incubated with a BiP antibody (Cell Signaling) and a donkey anti-rabbit secondary antibody (Jackson Immuno), reacted in ECL, and exposed to X-ray film. (b) Relative levels of BiP were determined using densitometry (n = 5 blots for each spinal cord). There was only a slight increasing trend in relative levels of BiP when comparing SOD1-untreated to SOD1-treated and WT mice. Statistical significance was determined using a two-way ANOVA followed by Tukey-Kramer post hoc test.
Figure 7
Figure 7
Muscles with type 1 fibers have increased expression of Hsp70 as compared to muscles with predominantly Type 2 fibers. (a) Images of representative Western blots probed for Hsp70 or actin (loading control). (b) Quantification of Hsp70 expression was performed with densitometry analysis confirmed increased expression of Hsp70 in muscles containing type 1 fibers. There was no significant difference in Hsp70 expression between WT and SOD1 muscles and treatment with rhHsp70 did not affect this expression. Statistical significance was determined using a two-way ANOVA followed by Tukey-Kramer post hoc test (n = 3  *P < 0.05).

Similar articles

Cited by

References

    1. Gould TW, Buss RR, Vinsant S, et al. Complete dissociation of motor neuron death from motor dysfunction by Bax deletion in a mouse model of ALS. Journal of Neuroscience. 2006;26(34):8774–8786. - PMC - PubMed
    1. Frey D, Schneider C, Xu L, Borg J, Spooren W, Caroni P. Early and selective loss of neuromuscular synapse subtypes with low sprouting competence in motoneuron diseases. Journal of Neuroscience. 2000;20(7):2534–2542. - PMC - PubMed
    1. Fischer LR, Culver DG, Tennant P, et al. Amyotrophic lateral sclerosis is a distal axonopathy: evidence in mice and man. Experimental Neurology. 2004;185(2):232–240. - PubMed
    1. Schaefer AM, Sanes JR, Lichtman JW. A compensatory subpopulation of motor neurons in a mouse model of amyotrophic lateral sclerosis. Journal of Comparative Neurology. 2005;490(3):209–219. - PubMed
    1. Saxena S, Cabuy E, Caroni P. A role for motoneuron subtype-selective ER stress in disease manifestations of FALS mice. Nature Neuroscience. 2009;12(5):627–636. - PubMed

LinkOut - more resources