. 2012 Aug 17:13:404.
doi: 10.1186/1471-2164-13-404.

Evolutionary paths of streptococcal and staphylococcal superantigens

Affiliations

Evolutionary paths of streptococcal and staphylococcal superantigens

Kayo Okumura et al. BMC Genomics. .

Abstract

Background: Streptococcus pyogenes (GAS) harbors several superantigens (SAgs) in the prophage region of its genome, although speG and smez are not located in this region. The diversity of SAgs is thought to arise during horizontal transfer, but their evolutionary pathways have not yet been determined. We recently completed sequencing the entire genome of S. dysgalactiae subsp. equisimilis (SDSE), the closest relative of GAS. Although speG is the only SAg gene of SDSE, speG was present in only 50% of clinical SDSE strains and smez in none. In this study, we analyzed the evolutionary paths of streptococcal and staphylococcal SAgs.

Results: We compared the sequences of the 12-60 kb speG regions of nine SDSE strains, five speG(+) and four speG(-). We found that the synteny of this region was highly conserved, whether or not the speG gene was present. Synteny analyses based on genome-wide comparisons of GAS and SDSE indicated that speG is the direct descendant of a common ancestor of streptococcal SAgs, whereas smez was deleted from SDSE after SDSE and GAS split from a common ancestor. Cumulative nucleotide skew analysis of SDSE genomes suggested that speG was located outside segments of steeper slopes than the stable region in the genome, whereas the region flanking smez was unstable, as expected from the results of GAS. We also detected a previously undescribed staphylococcal SAg gene, selW, and a staphylococcal SAg -like gene, ssl, in the core genomes of all Staphylococcus aureus strains sequenced. Amino acid substitution analyses, based on dN/dS window analysis of the products encoded by speG, selW and ssl suggested that all three genes have been subjected to strong positive selection. Evolutionary analysis based on the Bayesian Markov chain Monte Carlo method showed that each clade included at least one direct descendant.

Conclusions: Our findings reveal a plausible model for the comprehensive evolutionary pathway of streptococcal and staphylococcal SAgs.


Figures
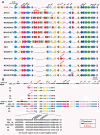
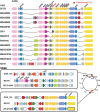
Figure 1
Figure 1
Synteny mapping of speG regions in SDSE and GAS genomes. (A) Genome context of speG and the 50 kb surrounding regions of the GGS_124 and 13 GAS strains. Each position (bp) on each genome is shown in Additional file 10. Some sequences encoding small peptides (20 to 30 amino acid residues) were annotated as having unknown functions or as hypothetical proteins and were omitted from this figure, because their assignments depended on the annotator. Transposase and IS elements are shown in red. hyp (in grey) indicates sequences encoding ‘hypothetical proteins’. Genes of the speG region of GGS_124 were inversely aligned. Pseudogenes are marked with asterisks. (B) Genome context of speG or the corresponding region in speG(+) and speG(−) SDSE strains. All information on the strains used in this study is shown in Additional file 1.
Figure 2
Figure 2
Synteny mapping of the smez region among SDSE and GAS genomes. Each position (bp) on each genome is shown in Additional file 10. The genes flanking flaR and the dpp operon were inversely aligned in three SDSE strains. The genomic locations of flaR and the dpp operon in SDSE and GAS are also shown.
Figure 3
Figure 3
Window analysis calculating dN/dS between GAS and SDSE. dN/dS was calculated as the ratio of nonsynonymous (dN) to synonymous (dS) substitution rates of gene pairs in speG (A) and pgi (B) from GAS and SDSE genomes. The figure shows only the results of comparisons between SSI-1 (GAS) and GGS_124 (SDSE). The X-axis represents nucleotide position.
Figure 4
Figure 4
Expression of genes surrounding speG. (A) RT-PCR analysis of the expression of the eight or nine genes surrounding speG in GGS_124 (SDSE) and MGAS6180 (GAS). The amino acid identity of each gene (%) in these two strains is indicated below each gene. (B) Putative predicted promoter regions at -10 bp and -35 bp of speG in GGS_124 and MGAS6180. The mutation in the putative -10 bp region in GGS_124 made it no longer a putative promoter region; it is therefore enclosed in a dotted line box.
Figure 5
Figure 5
Genome wide comparison among three SDSE genomes. (A) Genome rearrangement map among the three SDSE genomes. Each line joins two orthologues and the color of the lines represents the percentage of similarity between orthologous gene products (blue ≤ 40% ≤ green ≤ 60% ≤ yellow ≤ 70% ≤ orange ≤ 80% ≤ magenta ≤ 90% ≤ red). (B) Cumulative TA-skews for the three SDSE genomes. Gray boxes represent SSRs. Each page region in the GGS_124 and RE378 genomes is indicated with broken lines. The X-axis represents nucleotide position.
Figure 6
Figure 6
Synteny mapping of the selW region among S. aureus strains. Each position (bp) on each genome is shown in Additional file 10. Pseudogenes are marked with asterisks.
Figure 7
Figure 7
Window analysis calculating dN/dS of selW. dN/dS was calculated as the ratio of nonsynonymous (dN) to synonymous (dS) substitution rates of gene pairs in selW from two MRSA genomes. The figure shows only the comparison of COL and MRSA252. The X-axis represents nucleotide position.
Figure 8
Figure 8
Synteny mapping of the ssl cluster region among S. aureus strains. Each position (bp) on each genome is shown in Additional file 10. Pseudogenes are marked with asterisks, and transposons and insertion sequences are shown in red.
Figure 9
Figure 9
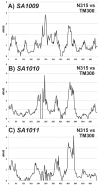
Window analysis calculating dN/dS of ssl. dN/dS was calculated as the ratio of nonsynonymous (dN) to synonymous (dS) substitution rates of gene pairs in ssl-12 and Sca_0905 (A), ssl-13 and Sca_0905 (B), and ssl-14 and Sca_0905 (C) from S. aureus and S. carnosus subsp. carnosus genomes. The figure shows only the comparison between N315 (S. aureus) and TM300 (S. carnosus subsp. carnosu). The X-axis represents nucleotide position.
Figure 10
Figure 10
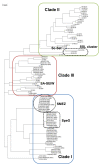
Phylogenetic tree of streptococcal and staphylococcal SAgs and SSL nucleotide sequences. The phylogenetic tree was constructed using the Bayesian MCMC method, with 100,000 generations. The resultant potential scale reduction factor was 1.078. Essentially the same result was obtained by changing the number of generations and by using the amino acid evolution model (data not shown). The nucleotide sequences used for alignment are shown in Additional file 9. The resulting phylogenetic tree was composed of three clades, with clade I including only streptococcal SAgs, clade II including only staphylococcal SSLs, and clade III including SAgs from both species. Orthologous gene products, including SpeG and SMEZ in clade I, SSL-like proteins in clade II and SElW in clade III, are emphasized.
Figure 11
Figure 11
Schematic diagram of the molecular evolution of streptococcal SAgs, SEs and SSLs. This model was based on the results of this study. S. aureus and Streptococcus are shown in blue and orange, respectively, with the two lineages of SAgs consisting of those derived from these two species. The first step of SAg diversification consisted of the mobilization of ancestral SAgs (ancestral selW and ssl-like genes in S. aureus, and speG and smez in Streptococcus) by mobile elements. During their repeated transfer among bacteria, genes that might have been incorporated into mobile elements diversified, were transferred to Streptococcus and became ancestral to streptococcal SAgs, similar to S. aureus SAgs such as speA and ssa. In streptococcal lineages, the ancestral bacterium of GAS and SDSE harbored ancestral speG and smez. After speciation of GAS and SDSE, smez was lost from the SDSE lineage during massive genome rearrangements, whereas speG in SDSE was inherited from ancestral GAS and SDSE. In the GAS lineage, horizontal transfer of SAgs by streptococcal phages was linked to their diversification.

References

    1. Alouf JE, Müller H. In: The comprehensive sourcebook of bacterial protein toxins. 3. Alouf JE, Popoff MR, editor. New York: Academic Press; 2006. What are superantigens? pp. 821–829.
    1. Fraser JD, Proft T. The bacterial superantigen and superantigen-like proteins. Immunol Rev. 2008;225:226–243. doi: 10.1111/j.1600-065X.2008.00681.x. - DOI - PubMed
    1. Brosnahan AJ, Schlievert PM. Gram-positive bacterial superantigen outside-in signaling causes toxic shock syndrome. FEBS J. 2011;278(23):4649–4667. doi: 10.1111/j.1742-4658.2011.08151.x. - DOI - PMC - PubMed
    1. Shimomura Y, Okumura K, Murayama SY, Yagi J, Ubukata K, Kirikae T, Miyoshi-Akiyama T. Complete genome sequencing and analysis of a Lancefield group G Streptococcus dysgalactiae subsp. equisimilis strain causing streptococcal toxic shock syndrome (STSS) BMC Genomics. 2011;12(1):17. doi: 10.1186/1471-2164-12-17. - DOI - PMC - PubMed
    1. McDonald M, Towers RJ, Andrews RM, Carapetis JR, Currie BJ. Epidemiology of Streptococcus dysgalactiae subsp. equisimilis in tropical communities, Northern Australia. Emerg Infect Dis. 2007;13(11):1694–1700. doi: 10.3201/eid1311.061258. - DOI - PMC - PubMed

Publication types

LinkOut - more resources