. 2012 Aug 17:12:358.
doi: 10.1186/1471-2407-12-358.

Identification of a novel set of genes reflecting different in vivo invasive patterns of human GBM cells

Affiliations

Identification of a novel set of genes reflecting different in vivo invasive patterns of human GBM cells

Massimiliano Monticone et al. BMC Cancer. .

Abstract

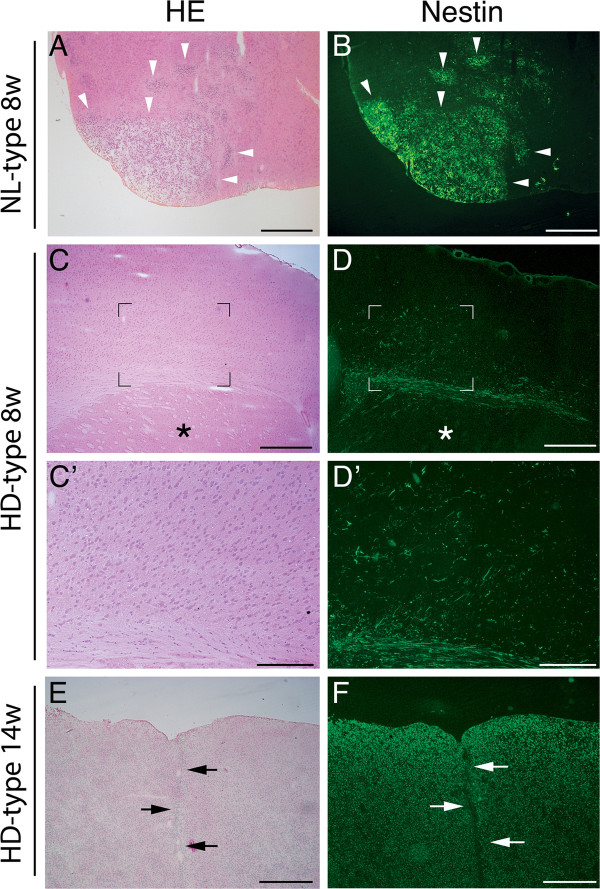
Background: Most patients affected by Glioblastoma multiforme (GBM, grade IV glioma) experience a recurrence of the disease because of the spreading of tumor cells beyond surgical boundaries. Unveiling mechanisms causing this process is a logic goal to impair the killing capacity of GBM cells by molecular targeting.We noticed that our long-term GBM cultures, established from different patients, may display two categories/types of growth behavior in an orthotopic xenograft model: expansion of the tumor mass and formation of tumor branches/nodules (nodular like, NL-type) or highly diffuse single tumor cell infiltration (HD-type).

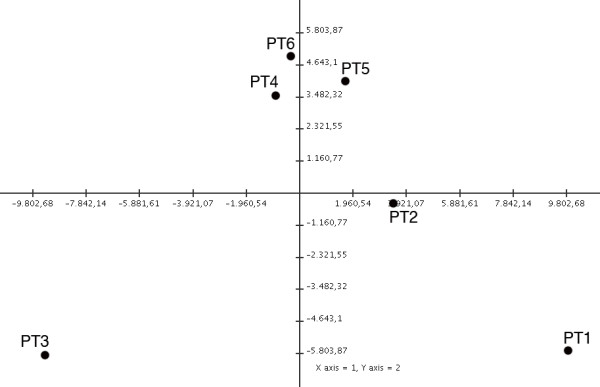
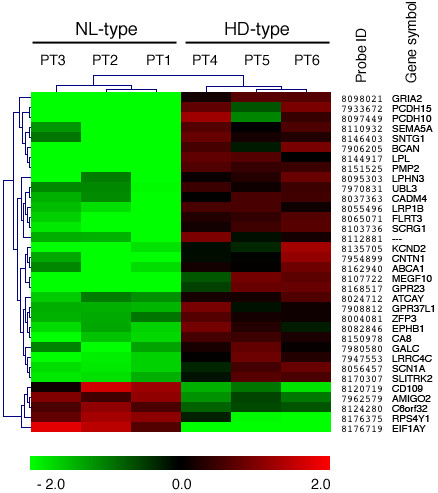
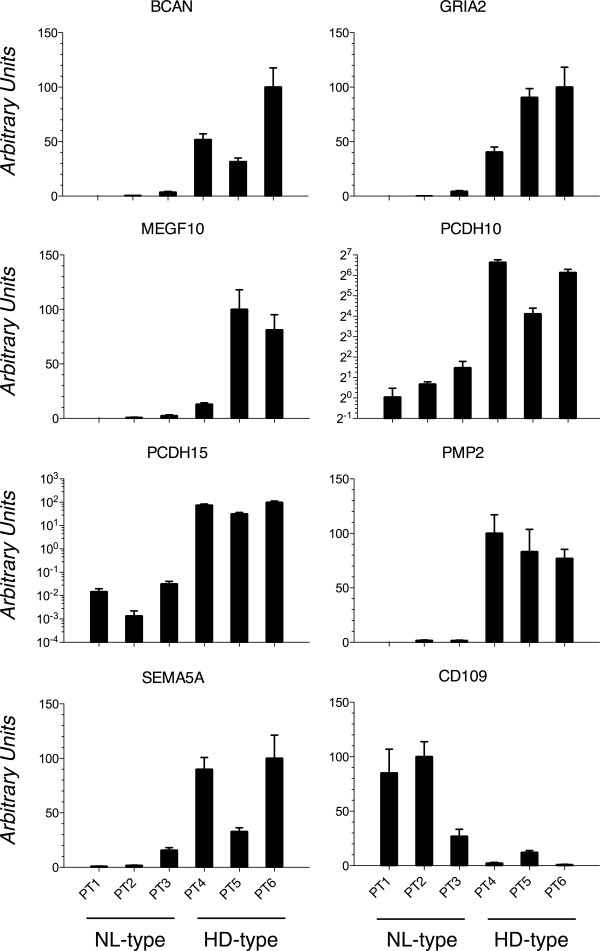
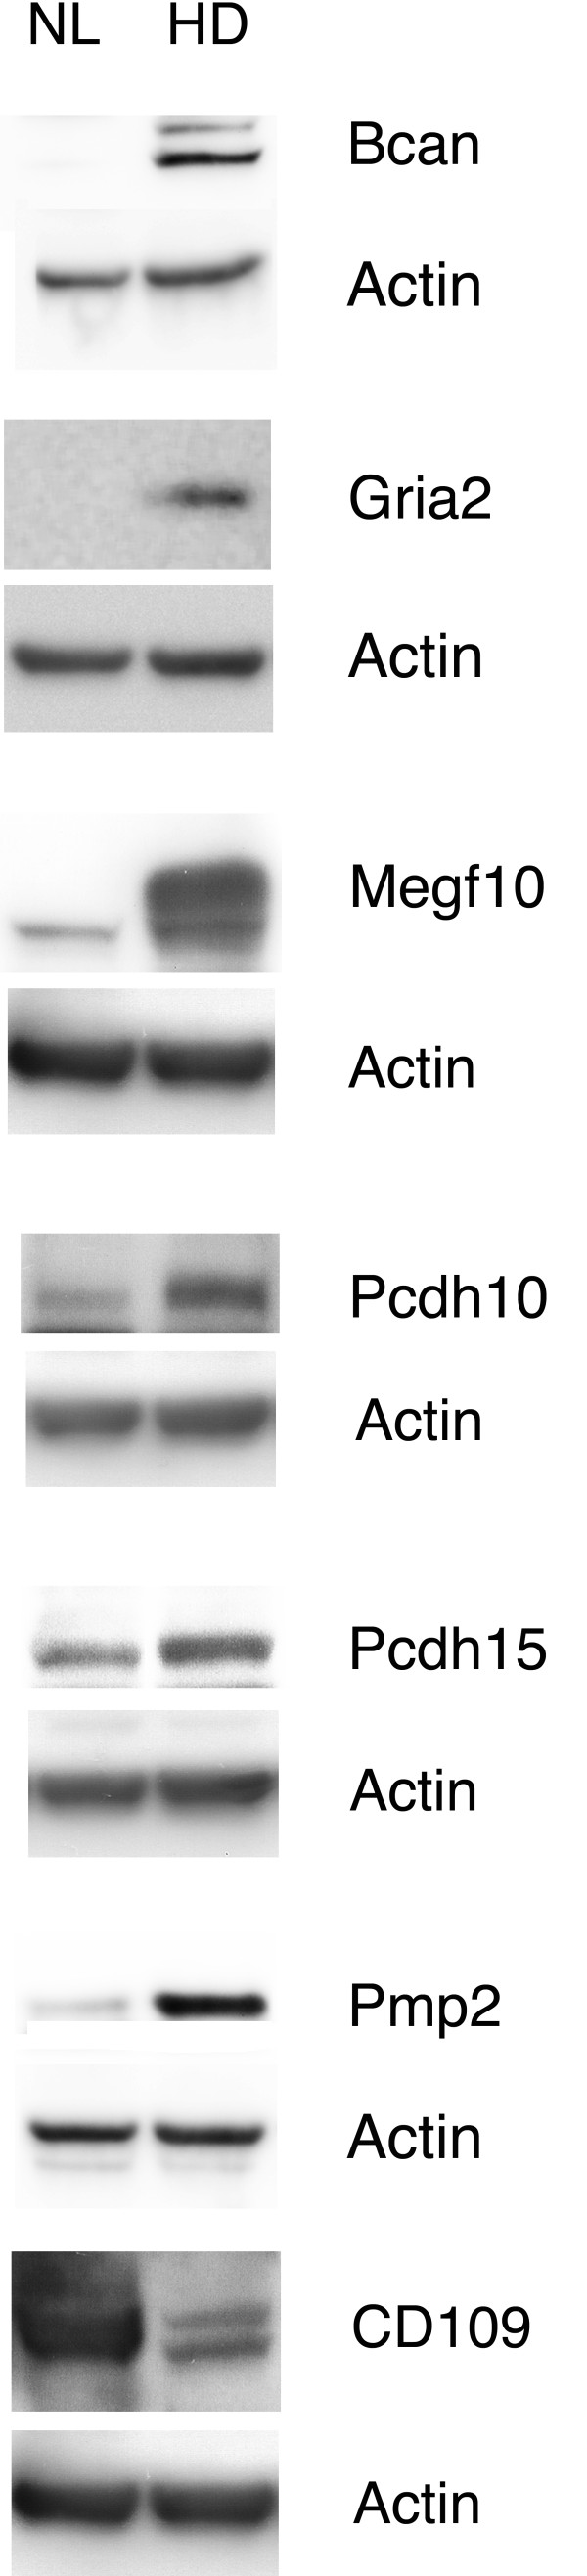
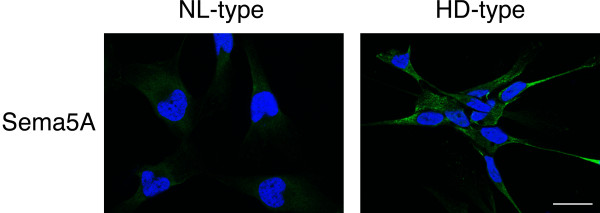
Methods: We determined by DNA microarrays the gene expression profiles of three NL-type and three HD-type long-term GBM cultures. Subsequently, individual genes with different expression levels between the two groups were identified using Significance Analysis of Microarrays (SAM). Real time RT-PCR, immunofluorescence and immunoblot analyses, were performed for a selected subgroup of regulated gene products to confirm the results obtained by the expression analysis.

Results: Here, we report the identification of a set of 34 differentially expressed genes in the two types of GBM cultures. Twenty-three of these genes encode for proteins localized to the plasma membrane and 9 of these for proteins are involved in the process of cell adhesion.

Conclusions: This study suggests the participation in the diffuse infiltrative/invasive process of GBM cells within the CNS of a novel set of genes coding for membrane-associated proteins, which should be thus susceptible to an inhibition strategy by specific targeting.Massimiliano Monticone and Antonio Daga contributed equally to this work.


Figures

Figure 1
Figure 1
Invasive behavior of human GBM cells in mouse orthotopic transplantation. Hematoxylin and Eosin (HE) staining (A, C, E) and immunofluorescence analyses (B, D, F) of mouse brains injected with human cultured GBM cells. The immunofluorescence analyses were performed with an anti-human nestin antibody. Human nestin, yielding a green signal, identify GBM cells within the host tissue. Nodular-like growth pattern at 8 weeks post-injection, NL-type 8w (A, B; PT2). Highly diffuse and invasive growth pattern at 8 and 14 weeks post-injection, HD-type 8w (C, D; PT6) and HD-type 14w (E, F; PT6). The asterisks indicate the striatum in (C, D). Higher magnification images of the areas whose corners are indicated by four (L) in (C, D) are shown in (C’, D’). Arrowheads indicate tumor nodules in (A, B). Notice in (C, D) scattered human nestin-positive GBM cells and lack of nodules. Notice in (E, F) the complete substitution of the host’s tissue by the engrafted human nestin-positive GBM cells. Arrows in (E, F) indicate brain midline. Scale bar = 500 μm in (A-F). Scale Bar = 200 μm in (C’, D’).
Figure 2
Figure 2
Microarray analysis performed with TIGR MeV program: principal component analysis. Microarray analysis of cultured human GBM cells generating tumor xenografts with nodular-like growth pattern, NL-type (PT1-3) or highly diffuse and invasive growth pattern, HD-type (PT4-6). Probe sets associated to dysregulation of gene expression levels among the six samples were identified using SAM (see Materials and Methods). Principal component analysis (PCA) is shown to provide the 2D projections onto the plane spanned by the two principal components for the data sets for each patient.
Figure 3
Figure 3
Microarray analysis performed with the TIGR MeV program: hierarchical clustering. Microarray analysis of cultured GBM cells and generating tumor xenografts with nodular-like growth pattern, NL-type (PT1-3) or highly diffuse and invasive growth pattern, HD-type (PT4-6). Heat map visualization obtained by hierarchical clustering (HCL). Probes corresponding to genes with similar regulation trend were placed close to each other as well as patient’s samples with overall similar gene expression pattern. The color-ratio bar at the bottom indicates intensity of gene up-regulation (red), down-regulation (green) and no change (black). Affymetrix Probes identification 7 digit numbers (Probe Id) along with Gene Symbols are shown on the right. Gene name symbols used are those approved by the Human Genome Organization Gene Nomenclature Committee (http://www.genenames.org/).
Figure 4
Figure 4
Real-Time RT-PCR validation of microarray data. Real-Time RT-PCR analysis performed on cultured GBM cells generating tumor xenografts with nodular-like growth pattern, NL-type (PT1-3) or highly diffuse and invasive growth pattern, HD-type (PT4-6) to validate the microarray data. This was accomplished on randomly selected genes from Table 2 and showed, in arbitrary units. Expression levels are relative to the expression of the housekeeping peptidyl-prolyl cis-trans isomerase A (PPIA) gene transcript. Standard deviations are indicated as vertical bars. Gene name symbols used are those approved by the Human Genome Organization Gene Nomenclature Committee (http://www.genenames.org/).
Figure 5
Figure 5
Validation of gene expression regulation by Immunoblot analysis. Western blot analyses were performed with lysates of cultured human GBM tumorigenic cells PT2 (belonging to the NL-type; NL) and PT6 (belonging to the HD-type; HD) challenged with Bcan, Gria2, Megf10, Pcdh10, Pcdh15, Pmp2 and CD109 antibodies. Each membrane was subjected to antibody stripping and rechallenged with an anti-actin antibody used as loading control.
Figure 6
Figure 6
Validation of gene expression regulation by Immunofluorescence analysis. Indirect immunofluorescence analysis was performed on cultured human GBM tumorigenic cells PT2 (belonging to the NL-type) and PT6 (belonging to the HD-type), by using a specific antibody anti-Sema5A (green signal). Nuclei were stained by the Hoechst dye (blue signal). Merged imaged are shown. Scale bar = 20 μm,

Similar articles

Cited by

References

    1. Demuth T, Berens ME. Molecular mechanisms of glioma cell migration and invasion. J Neurooncol. 2004;70(2):217–228. doi: 10.1007/s11060-004-2751-6. - DOI - PubMed
    1. Silbergeld DL, Chicoine MR. Isolation and characterization of human malignant glioma cells from histologically normal brain. J Neurosurg. 1997;86(3):525–531. doi: 10.3171/jns.1997.86.3.0525. - DOI - PubMed
    1. D'Abaco GM, Kaye AH. Integrins: molecular determinants of glioma invasion. J Clin Neurosci. 2007;14(11):1041–1048. doi: 10.1016/j.jocn.2007.06.019. - DOI - PubMed
    1. Harpold HL, Alvord EC, Swanson KR. The evolution of mathematical modeling of glioma proliferation and invasion. J Neuropathol Exp Neurol. 2007;66(1):1–9. doi: 10.1097/nen.0b013e31802d9000. - DOI - PubMed
    1. Hoelzinger DB, Demuth T, Berens ME. Autocrine factors that sustain glioma invasion and paracrine biology in the brain microenvironment. J Natl Cancer Inst. 2007;99(21):1583–1593. doi: 10.1093/jnci/djm187. - DOI - PubMed

Publication types

MeSH terms