. 2012 Aug 18:12:359.
doi: 10.1186/1471-2407-12-359.

Protein markers of cancer-associated fibroblasts and tumor-initiating cells reveal subpopulations in freshly isolated ovarian cancer ascites

Affiliations

Protein markers of cancer-associated fibroblasts and tumor-initiating cells reveal subpopulations in freshly isolated ovarian cancer ascites

My Wintzell et al. BMC Cancer. .

Abstract

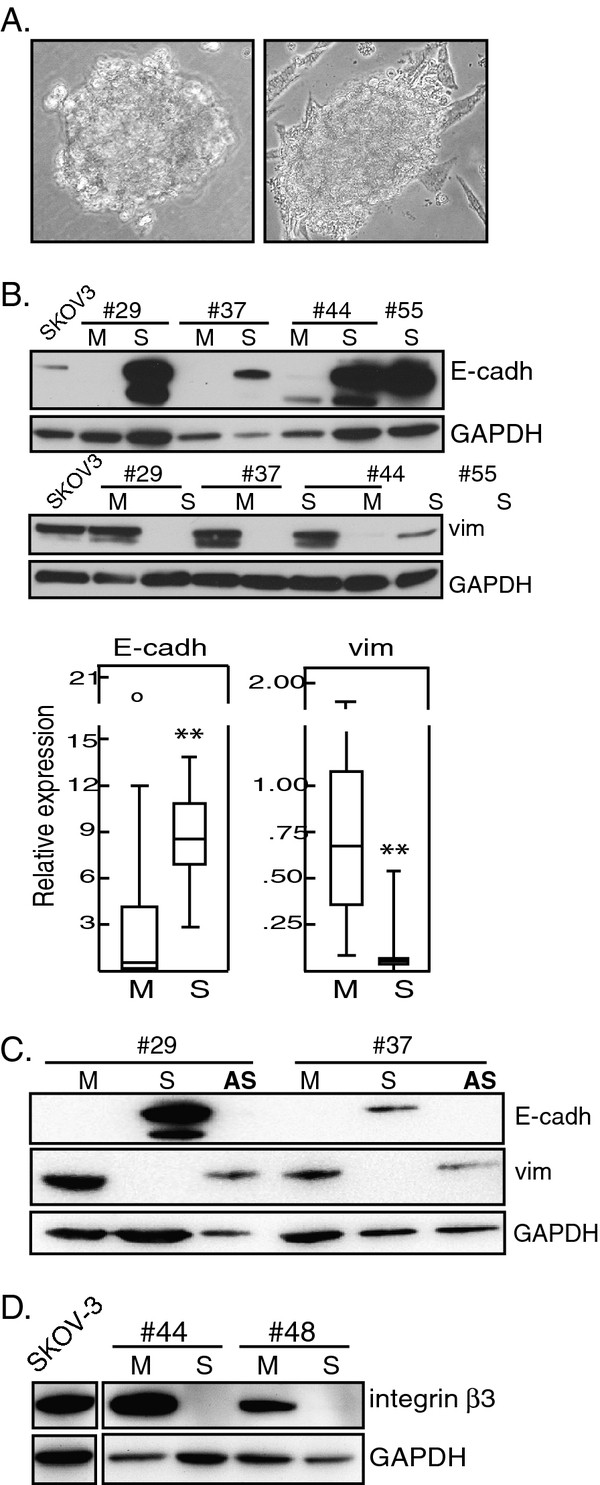
Background: In ovarian cancer, massive intraperitoneal dissemination is due to exfoliated tumor cells in ascites. Tumor-initiating cells (TICs or cancer stem cells) and cells showing epithelial-mesenchymal-transition (EMT) are particularly implicated. Spontaneous spherical cell aggregates are sometimes observed, but although similar to those formed by TICs in vitro, their significance is unclear.

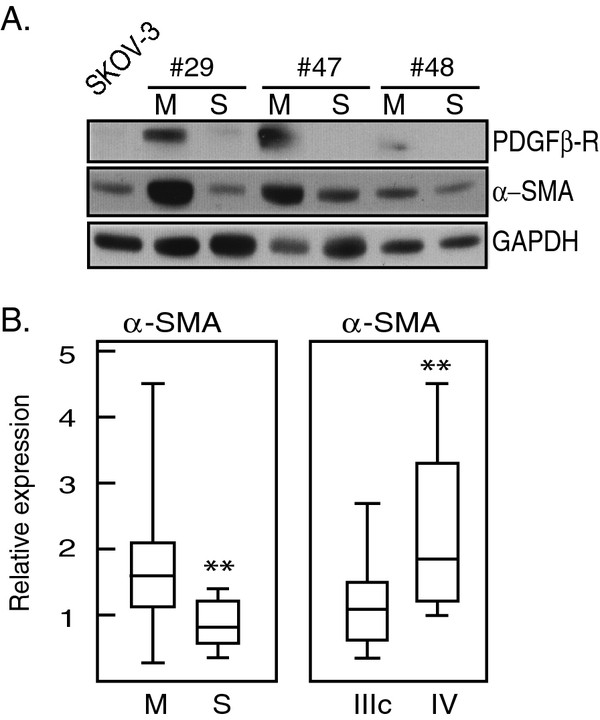
Methods: Cells freshly isolated from malignant ascites were separated into sphere samples (S-type samples, n=9) and monolayer-forming single-cell suspensions (M-type, n=18). Using western blot, these were then compared for expression of protein markers of EMT, TIC, and of cancer-associated fibroblasts (CAFs).

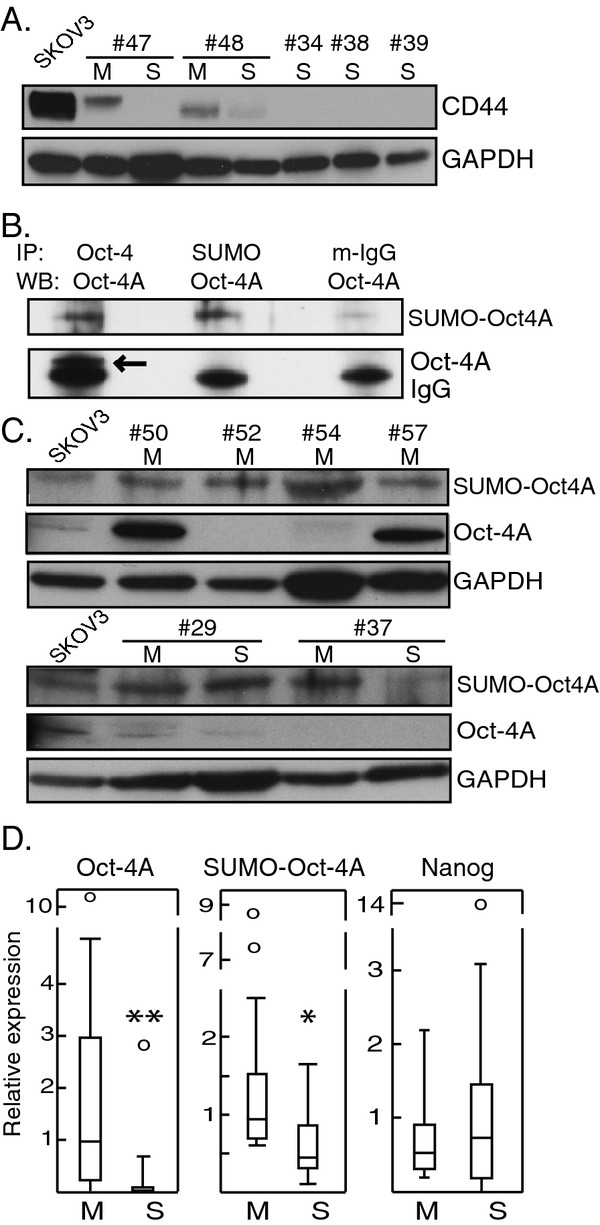
Results: S-type cells differed significantly from M-type by expressing high levels of E-cadherin and no or little vimentin, integrin-β3 or stem cell transcription factor Oct-4A. By contrast, M-type samples were enriched for CD44, Oct-4A and for CAF markers. Independently of M- and S-type, there was a strong correlation between TIC markers Nanog and EpCAM. The CAF marker α-SMA correlated with clinical stage IV. This is the first report on CAF markers in malignant ascites and on SUMOylation of Oct-4A in ovarian cancer.

Conclusions: In addition to demonstrating potentially high levels of TICs in ascites, the results suggest that the S-type population is the less tumorigenic one. Nanog(high)/EpCAM(high) samples represent a TIC subset which may be either M- or S-type, and which is separate from the CD44(high)/Oct-4A(high) subset observed only in M-type samples. This demonstrates a heterogeneity in TIC populations in vivo which has practical implications for TIC isolation based on cell sorting. The biological heterogeneity will need to be addressed in future therapeutical strategies.


Figures

Figure 1
Figure 1
Spheres constitute a separate population. Ascitic cells were isolated from ovarian cancer patient ascites and separated into monolayer-forming single-cell suspensions (M-type samples; M) and spontaneous spheres (S-type samples; S), all as described in Materials and Methods. Lysates of each sample were analysed by western blot, with GAPDH as loading control. As interblot reference, a lysate (one and the same for all experiments) of the SKOV-3 cell line, derived from EOC malignant ascites, was used. Numbers refer to patients. A. Representative images of spheres, 40x magnification. Left: immediately after isolation. Right: Dispersed spheres do not form monolayers in culture, but continue to form spheres like this one and which then detach from the few adherent cells seen in the background. B.Top: Representative example of E-cadherin and vimentin expression in paired M- and S-type samples, each pair from one and the same patient. Below: The data on E-cadherin and vimentin expression levels throughout the whole cohort are summarized in box plots comparing the distribution of relative expression of these proteins in all M (n = 18) and S (n = 9) samples, respectively. Asterisks denote statistically significant differences (Mann–Whitney U test). C. Representative examples of E-cadherin and vimentin expression in paired M- and S-samples from two patients, and artificial spheroids (AS) created in vitro using the M-sample cells. D. Expression of integrin β3 in two paired M- and S-type samples, each pair from one and the same patient.
Figure 2
Figure 2
Presence of cancer-associated fibroblasts in ascites. A representative western blots showing co-expression of PDGFβR and α-SMA in paired M- and S-samples from three patients. In total 9/25 samples showed expression of PDGFβR, all of them M-type. Numbers refers to patients. B. Box plots comparing the distribution of relative expression of α-SMA in M- (n = 17) and S-type (n = 8) samples (left) and in samples representing clinical stage IIIC (n = 17) and IV (n = 8) at diagnosis (right). Asterisks denote statistically significant difference (Independent t-test).
Figure 3
Figure 3
TIC protein marker expression in M- and S-type samples. A. Representative blot showing CD44 expression in M- and S-type samples. Based on all samples, CD44 was associated with M-type (p<0.001; Table 2). Numbers refer to patients. B. The SKOV-3 cell line was used for immunoprecipitation with antibodies to Oct-4 and to SUMO, respectively. Shown here is a representative western blot of three immunoprecipitates made with antibodies to Oct-4, SUMO and mouse IgG, respectively, and which were then probed using anti-Oct-4A. Mouse IgG served as negative control. SUMO-Oct-4A could be detected when probed with anti-SUMO (not shown). The results were confirmed using two other cell lines (not shown). Arrow: native ~40 kDa Oct-4A just above the 25 kDa IgG light chain. IP: immunoprecipitation; WB: western blot probe; m-IgG: mouse IgG.C. Oct-4A and SUMO-Oct-4A in M-type samples and paired samples of M- and S-type. D. Box plots comparing the distribution of relative expression of Oct-4A, SUMO-Oct-4A and Nanog, respectively, in all M (n=18) and S (n=9) samples. Asterisks denote statistically significant differences (Mann–Whitney U test).

Similar articles

Cited by

References

    1. Landen CN Jr, Birrer MJ, Sood AK. Early events in the pathogenesis of epithelial ovarian cancer. J Clin Oncol. 2008;26(6):995–1005. doi: 10.1200/JCO.2006.07.9970. - DOI - PubMed
    1. Ahmed N, Thompson EW, Quinn MA. Epithelial-mesenchymal interconversions in normal ovarian surface epithelium and ovarian carcinomas: an exception to the norm. J Cell Physiol. 2007;213(3):581–588. doi: 10.1002/jcp.21240. - DOI - PubMed
    1. Veatch AL, Carson LF, Ramakrishnan S. Differential expression of the cell-cell adhesion molecule E-cadherin in ascites and solid human ovarian tumor cells. Int J Cancer. 1994;58(3):393–399. doi: 10.1002/ijc.2910580315. - DOI - PubMed
    1. Sodek KL, Ringuette MJ, Brown TJ. Compact spheroid formation by ovarian cancer cells is associated with contractile behavior and an invasive phenotype. Int J Cancer. 2009;124(9):2060–2070. doi: 10.1002/ijc.24188. - DOI - PubMed
    1. Burleson KM, Hansen LK, Skubitz AP. Ovarian carcinoma spheroids disaggregate on type I collagen and invade live human mesothelial cell monolayers. Clin Exp Metastasis. 2004;21(8):685–697. - PubMed

Publication types

MeSH terms