Directed evolution reveals requisite sequence elements in the functional expression of P450 2F1 in Escherichia coli
- PMID: 22901340
- PMCID: PMC3466110
- DOI: 10.1021/tx300281g
Directed evolution reveals requisite sequence elements in the functional expression of P450 2F1 in Escherichia coli
Abstract
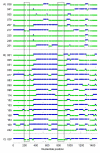
Cytochrome P450 2F1 (P450 2F1) is expressed exclusively in the human respiratory tract and is implicated in 3-methylindole (3MI)-induced pneumotoxicity via dehydrogenation of 3MI to a reactive electrophilic intermediate, 3-methyleneindolenine (3-MEI). Studies of P450 2F1 to date have been limited by the failure to express this enzyme in Escherichia coli. By contrast, P450 2F3, a caprine homologue that shares 84% sequence identity with P450 2F1 (86 amino acid differences), has been expressed in E. coli at yields greater than 250 nmol/L culture. We hypothesized that a limited number of sequence differences between P450s 2F1 and 2F3 could limit P450 2F1 expression in E. coli and that problematic P450 2F1 sequence elements could be identified by directed evolution. A library of P450 2F1/2F3 mutants was created by DNA family shuffling and screened for expression in E. coli. Three generations of DNA shuffling revealed a mutant (named JH_2F_F3_1_007) with 96.5% nucleotide sequence identity to P450 2F1 and which expressed 119 ± 40 pmol (n = 3, mean ± SD) hemoprotein in 1 mL microaerobic cultures. Across all three generations, two regions were observed where P450 2F3-derived sequence was consistently substituted for P450 2F1 sequence in expressing mutants, encoding nine amino acid differences between P450s 2F1 and 2F3: nucleotides 191-278 (amino acids 65-92) and 794-924 (amino acids 265-305). Chimeras constructed to specifically test the importance of these two regions confirmed that P450 2F3 sequence is essential in both regions for expression in E. coli but that other non-P450 2F1 sequence elements outside of these regions also improved the expression of mutant JH_2F_F3_1_007. Mutant JH_2F_F3_1_007 catalyzed the dehydrogenation of 3MI to 3-MEI as indicated by the observation of glutathione adducts after incubation in the presence of glutathione. The JH_2F_F3_1_007 protein differs from P450 2F1 at only 20 amino acids and should facilitate further studies of the structure-activity relationships of P450s of the 2F subfamily.
Figures


Similar articles
-
Cloning and expression of CYP2F3, a cytochrome P450 that bioactivates the selective pneumotoxins 3-methylindole and naphthalene.Arch Biochem Biophys. 1998 Jan 15;349(2):329-40. doi: 10.1006/abbi.1997.0479. Arch Biochem Biophys. 1998. PMID: 9448722
-
Single mutations change CYP2F3 from a dehydrogenase of 3-methylindole to an oxygenase.Biochemistry. 2008 Sep 16;47(37):9756-70. doi: 10.1021/bi8005658. Epub 2008 Aug 22. Biochemistry. 2008. PMID: 18717595 Free PMC article.
-
3-Methylindole metabolites induce lung CYP1A1 and CYP2F1 enzymes by AhR and non-AhR mechanisms, respectively.Chem Res Toxicol. 2010 Mar 15;23(3):696-704. doi: 10.1021/tx9004506. Chem Res Toxicol. 2010. PMID: 20187624 Free PMC article.
-
P450BM-3; a tale of two domains--or is it three?Steroids. 1997 Jan;62(1):117-23. doi: 10.1016/s0039-128x(96)00169-9. Steroids. 1997. PMID: 9029725 Review.
-
Functional expression of human cytochrome P450 enzymes in Escherichia coli.Curr Drug Metab. 2006 May;7(4):411-29. doi: 10.2174/138920006776873472. Curr Drug Metab. 2006. PMID: 16724930 Review.
Cited by
-
Reductive Cytochrome P450 Reactions and Their Potential Role in Bioremediation.Front Microbiol. 2021 Apr 15;12:649273. doi: 10.3389/fmicb.2021.649273. eCollection 2021. Front Microbiol. 2021. PMID: 33936006 Free PMC article. Review.
-
Human CYP2A13 and CYP2F1 Mediate Naphthalene Toxicity in the Lung and Nasal Mucosa of CYP2A13/2F1-Humanized Mice.Environ Health Perspect. 2017 Jun 8;125(6):067004. doi: 10.1289/EHP844. Environ Health Perspect. 2017. PMID: 28599267 Free PMC article.
-
Structure-Function Studies of Naphthalene, Phenanthrene, Biphenyl, and Their Derivatives in Interaction with and Oxidation by Cytochromes P450 2A13 and 2A6.Chem Res Toxicol. 2016 Jun 20;29(6):1029-40. doi: 10.1021/acs.chemrestox.6b00083. Epub 2016 May 12. Chem Res Toxicol. 2016. PMID: 27137136 Free PMC article.
References
-
- Bieche I, Narjoz C, Asselah T, Vacher S, Marcellin P, Lidereau R, Beaune P, de Waziers I. Reverse transcriptase(PCR quantification of mRNA levels from cytochrome (CYP)1, CYP2 and CYP3 families in 22 different human tissues. Pharmacogenet. Genomics. 2007;17:731–742. - PubMed
-
- Nhamburo PT, Kimura S, McBride OW, Kozak CA, Gelboin HV, Gonzalez FJ. The human CYP2F gene subfamily: identification of a cDNA encoding a new cytochrome P450, cDNA-directed expression, and chromosome mapping. Biochemistry. 1990;29:5491–5499. - PubMed
-
- Zhang X, Zhang QY, Liu D, Su T, Weng Y, Ling G, Chen Y, Gu J, Schilling B, Ding X. Expression of cytochrome P450 and other biotransformation genes in fetal and adult human nasal mucosa. Drug Metab. Dispos. 2005;33:1423–1428. - PubMed
-
- Lanza DL, Code E, Crespi CL, Gonzalez FJ, Yost GS. Specific dehydrogenation of 3-methylindole and epoxidation of naphthalene by recombinant human CYP2F1 expressed in lymphoblastoid cells. Drug Metab. Dispos. 1999;27:798–803. - PubMed
-
- Nakajima T, Elovaara E, Gonzalez FJ, Gelboin HV, Raunio H, Pelkonen O, Vainio H, Aoyama T. Styrene metabolism by cDNA-expressed human hepatic and pulmonary cytochromes P450. Chem. Res. Toxicol. 1994;7:891–896. - PubMed
Publication types
MeSH terms
Substances
Grants and funding
LinkOut - more resources
Full Text Sources
Miscellaneous

