. 2012 Aug 31;150(5):961-74.
doi: 10.1016/j.cell.2012.07.028. Epub 2012 Aug 14.

Cohesin's DNA exit gate is distinct from its entrance gate and is regulated by acetylation

Affiliations

Cohesin's DNA exit gate is distinct from its entrance gate and is regulated by acetylation

Kok-Lung Chan et al. Cell. .

Abstract

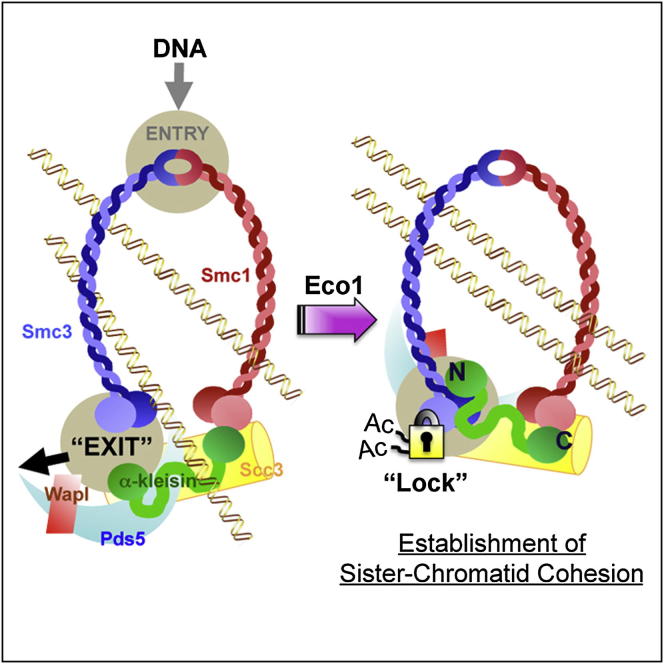
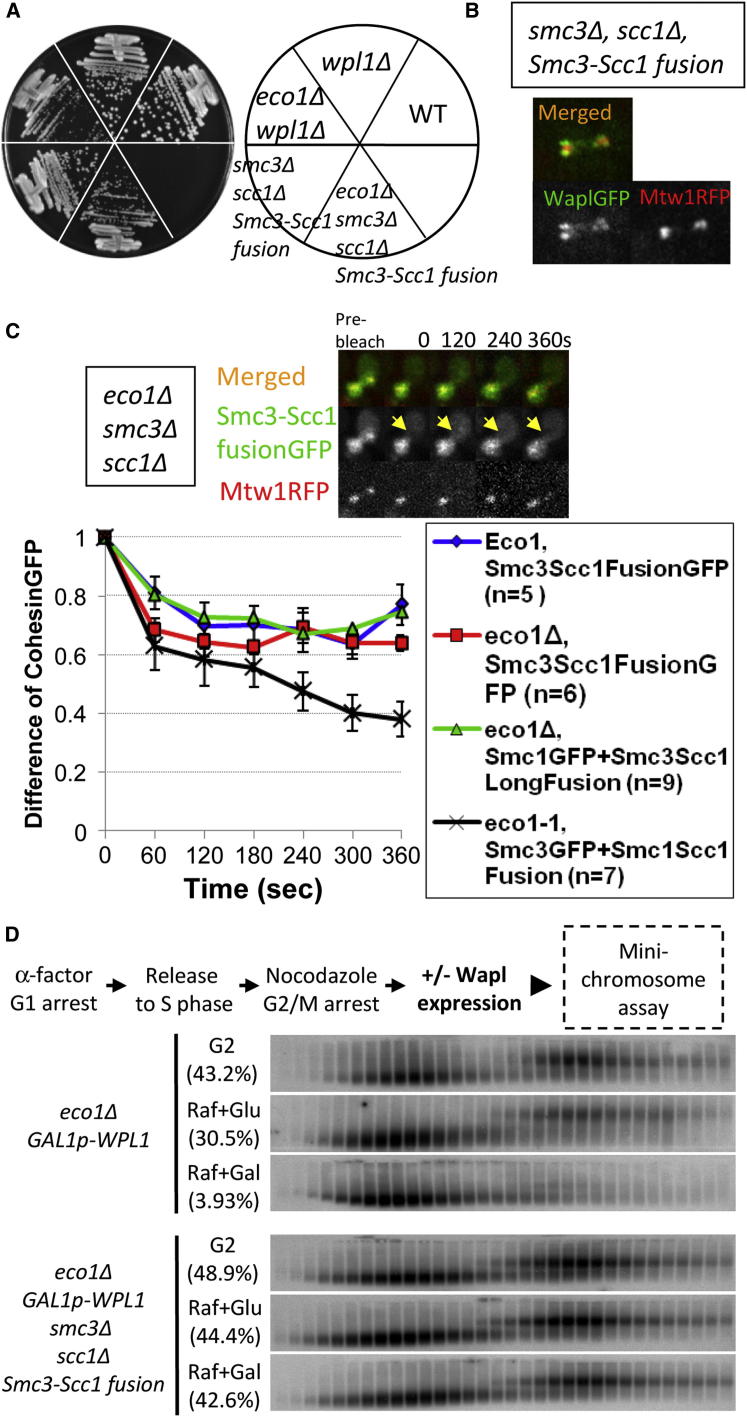
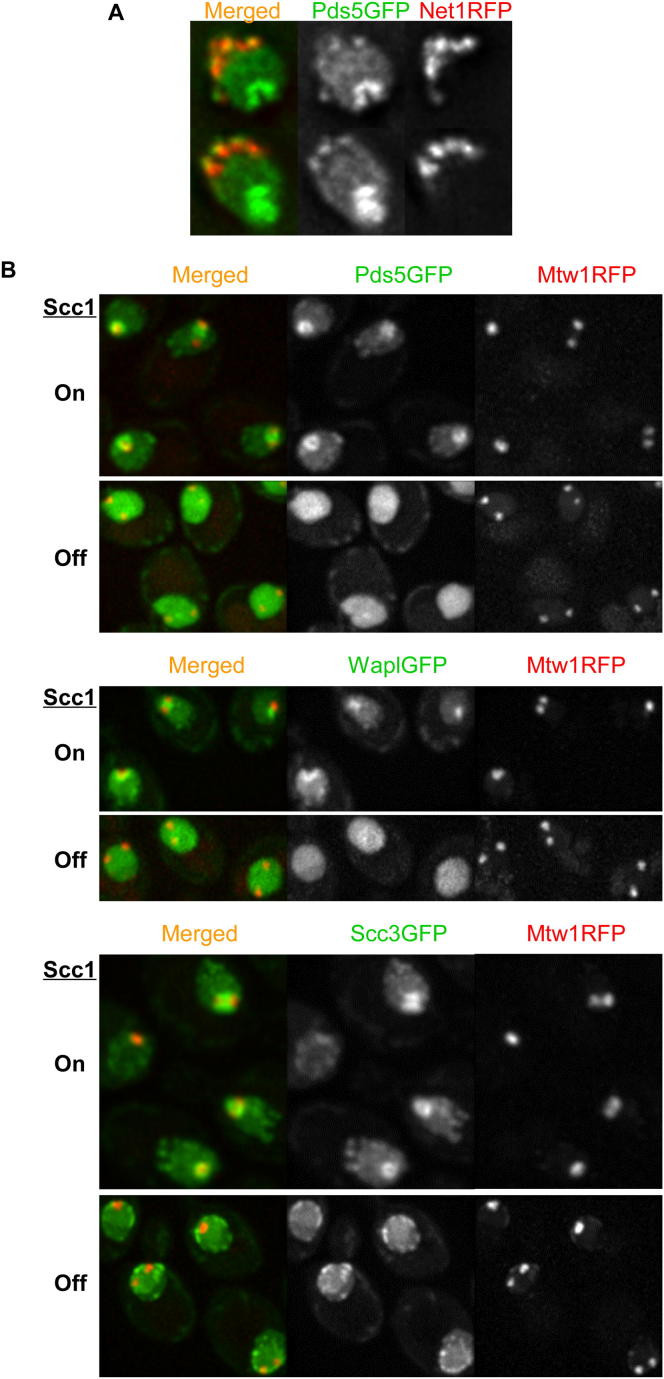
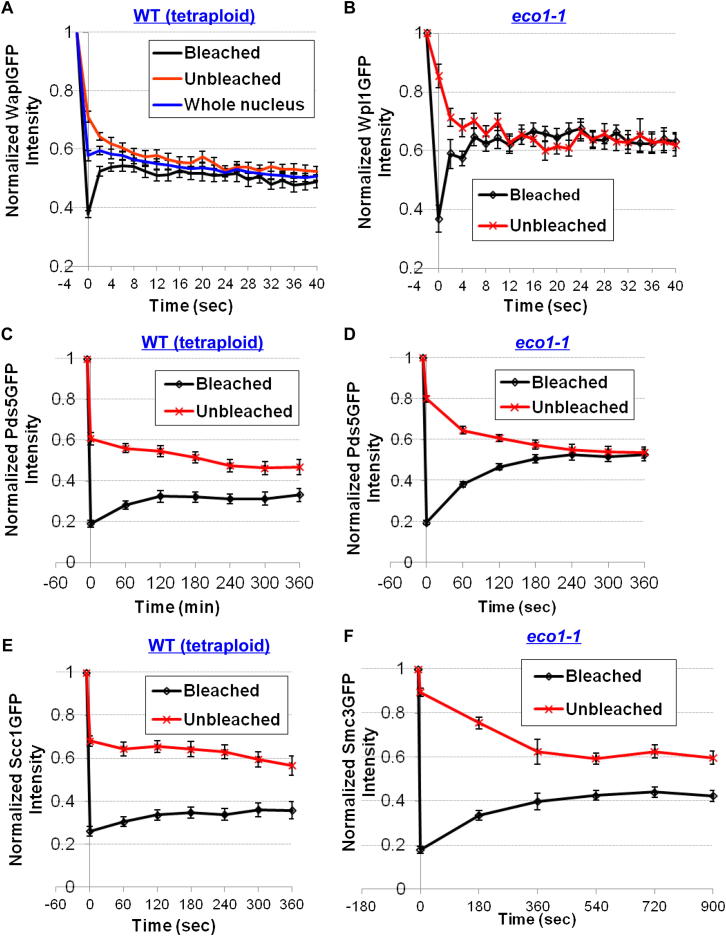
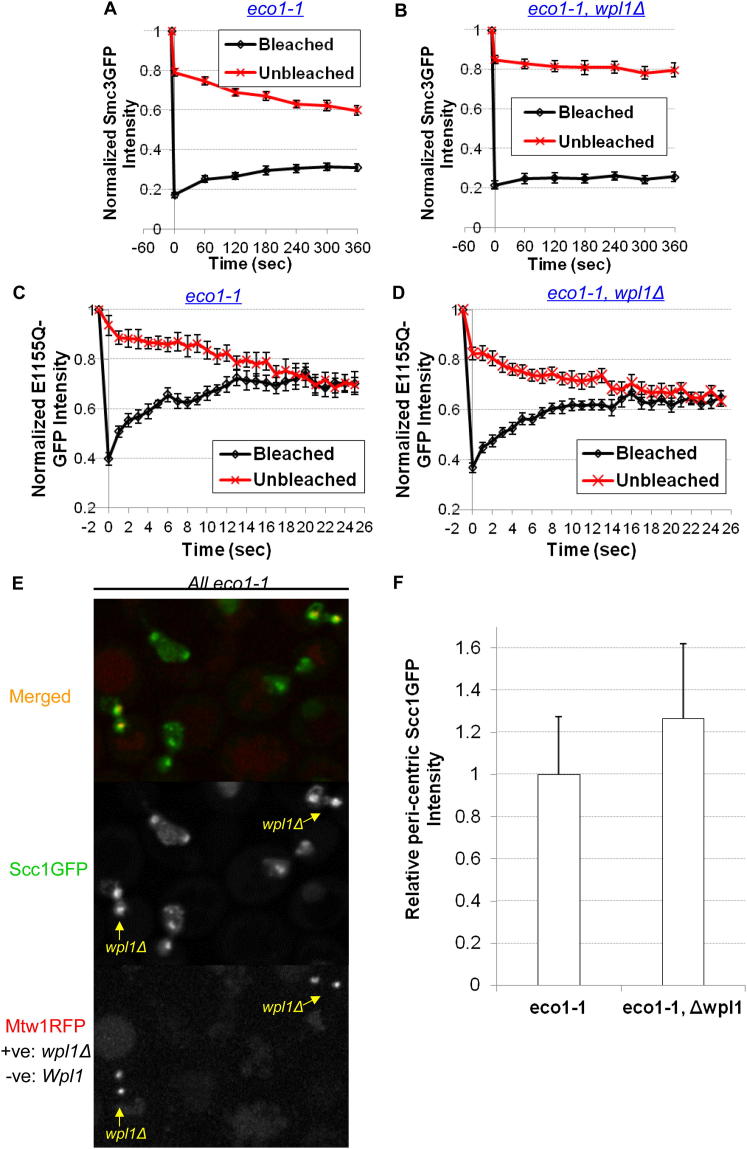
Sister chromatid cohesion is mediated by entrapment of sister DNAs by a tripartite ring composed of cohesin's Smc1, Smc3, and α-kleisin subunits. Cohesion requires acetylation of Smc3 by Eco1, whose role is to counteract an inhibitory (antiestablishment) activity associated with cohesin's Wapl subunit. We show that mutations abrogating antiestablishment activity also reduce turnover of cohesin on pericentric chromatin. Our results reveal a "releasing" activity inherent to cohesin complexes transiently associated with Wapl that catalyzes their dissociation from chromosomes. Fusion of Smc3's nucleotide binding domain to α-kleisin's N-terminal domain also reduces cohesin turnover within pericentric chromatin and permits establishment of Wapl-resistant cohesion in the absence of Eco1. We suggest that releasing activity opens the Smc3/α-kleisin interface, creating a DNA exit gate distinct from its proposed entry gate at the Smc1/3 interface. According to this notion, the function of Smc3 acetylation is to block its dissociation from α-kleisin. The functional implications of regulated ring opening are discussed.


Figures

None
Graphical abstract
Figure 1
Figure 1
Wapl Destroys Cohesion after DNA Replication Minichromosome dimers and monomers were separated by sucrose gradient sedimentation and gel electrophoresis and detected by Southern blotting. (A) Strains K17615, K18942, and K18943 were incubated with α-factor for 1.5 hr in YEP raffinose media and cultures split; 2% galactose was added to one, which induced Wapl. Cells were subsequently incubated in media lacking pheromone but containing 10 μg/ml nocodazole and harvested after 90 min. (B) As for (A), except Wapl expression was induced by adding galactose 90 min after release from pheromone. (“D” and “M” denote dimeric and monomeric minichromosomes, respectively; arrowheads indicate loss of minichromosomes dimers; Brackets denote percentages of DNAs in dimeric fractions).
Figure 2
Figure 2
Wapl Is Substoichiometric (A) Live images of GFP-tagged Smc1, Pds5 (K17792), Wapl (K18804), and Scc3 (K18110) forming pericentric barrels in wild-type G2/M diploids. (B) Relative GFP intensities of cohesin subunits at pericentric regions in living wild-type G2/M diploids (K17792, K19367, K19003, K18785, K18396, and K18110). Fluorescence was quantified on the same slides containing yeast strains expressing different cohesin subunits tagged with GFP. All strains except Smc1(hetero) were homozygous. The identity of strains was determined by using different RFP-tagged proteins. Three sets of quantitation experiments were performed with different combinations of yeast strains. Seventeen Z stacking images were acquired with 0.2 μm intervals. Data are represented as mean of GFP intensity ± standard deviation (SD). In eco1-1 diploids, the relative mean GFP intensities ± SD of Scc1 (K19004) and Wapl (K18420) to that of Pds5 (K19005) (1.00 ± 0.28; n = 107) were 1.12 ± 0.28; n = 103 and 0.25 ± 0.08; n = 106, respectively. n = number of cells examined. (C) SDS-PAGE showing relative protein levels in strains containing either Wapl or Pds5, or both Wapl and Pds5 tagged with GFP (K16574, K17180, K18714, and K18516). (D) Heterozygous Wapl-GFP over a deletion is sufficient to cause lethality in eco1-1 diploids at restrictive temperature (haploid: K18335, K18417, K19001; diploid: K18420, K19040, K19039). (E) Suppressor mutations in the N-terminal region of Pds5 abolish pericentric Wapl recruitment. Live-cell imaging shows localization of Wapl-GFP localization in wild-type (K18396) or pds5 mutants S81R (K19125), A88P (K19200), E181K (K19192), and C599F (K19199). (F) N-terminal region of Pds5 is not required for its pericentric localization (K19105). See also Figure S1 for Scc1 dependence of the pericentric localization of Pds5, Wapl, and Scc3.
Figure 3
Figure 3
Turnover of Pds5 but Not Wapl Is Regulated by Eco1 (A) The entire Wapl-GFP barrel region was photobleached (indicated by a dotted circle) in wild-type tetraploid cells (K18804) and single-stacking images acquired every 2 s. In eco1-1 diploids (K18420), one of the two sister-centromere clusters, was photobleached (indicated by arrows) after preincubation at nonpermissive temperature for 90 min. (B) One half of Pds5-GFP barrels in tetraploids (K18407) or one of two foci in eco1-1 diploids (K18419) were photobleached (indicated by arrows) and five Z stacking images with 0.4 μm intervals undertaken every 60 s for 360 s. (C) Dynamics of Scc1 in wild-type tetraploids (K18246) and eco1-1 diploids (K18402). Photobleaching and imaging was done as (B). (D) Cohesin dynamics in eco1-1 cells over an extended period. Photobleaching and imaging was done as in (B), but imaging was done after photobleaching for 900 s in Smc3-GFP (K18454) and Scc1-GFP (K18402) eco1-1 diploids. Data are represented as mean difference of normalized fluorescence intensity between bleached and unbleached regions ± SEM. n = the number of cells examined. Sister-centromere clusters are marked by Mtw1RFP. See also Figure S2 for normalized fluorescence intensity of unbleached and bleached regions.
Figure 4
Figure 4
Pericentric Cohesin Turnover Depends on Wapl (A) Dynamics of pericentric Scc1-GFP in WPL1+ (K18246), previously shown in Figure 3C, and wpl1Δ (K18754) tetraploids. (B) Dynamics of pericentric Smc3-GFP in eco1-1 (K18454) and eco1-1 wpl1Δ (K18784) diploids. Cells were preincubated at the nonpermissive temperature for 90 min to inactive eco1-1. (C) Dynamics of ATP-hydrolysis mutant Smc3E1155Q in eco1-1 (K19362) and eco1-1 wpl1Δ (K19037) diploids. Data are represented as mean difference of normalized fluorescence intensity between bleached and unbleached regions ± SEM. n = the number of cells examined. See also Figure S3 for normalized fluorescence intensity of unbleached and bleached regions and the effect of wpl1Δ on the amounts of pericentric cohesin in eco1-1 mutants, respectively. (D) FLIP analysis of pericentric Scc1-GFP in WPL1+ (K19295) and wpl1Δ (K19297) a/a diploids. Cells were arrested in late G1 by overexpression of nondegradable sic1(9 m) following α-factor release. A single laser beam (red circle) repeatedly photobleached a point outside pericentric regions (arrows). a/a diploids were used to minimize off target photobleaching. FLIP was performed at least 60 min after pheromone release to ensure maximum loading of cohesin onto pericentric chromatin. Data are represented as mean relative fluorescence loss (Scc1GFP/Mtw1RFP) at pericentric regions ± SEM. n = the number of cells examined. See also Figures S4 and S5 for late G1 arrest and normalized fluorescence intensity. Sister-centromere clusters are marked by Mtw1RFP.
Figure 5
Figure 5
Cohesin Turnover Is Reduced by Antiestablishment Mutations (A) Dynamics of pericentric cohesin in eco1-1 (K18402, K18454, and K18455) and in eco1-1 smc3S75R (K19306), eco1-1 pds5A88P (K19066), and eco1-1 scc3E202K (K19203) diploids. Cells were preincubated at the restrictive temperature for 90 min before photobleaching. Data are represented as mean difference of normalized fluorescence intensity between bleached and unbleached regions ± SEM. n = the number of cells examined. See also Figure S6 for normalized fluorescence intensity of unbleached and bleached regions. (B) Wapl-GFP localization in “antiestablishment” mutants (K19253, K19254, K19257, and K19252). (C) Summary of pericentric recruitment of Wapl in (B).
Figure 6
Figure 6
Fusion of Smc3 to α-Kleisin Protects Cohesin from Its Releasing Activity (A) Cells expressing the Smc3-Scc1 fusion protein rescue eco1Δ lethality (K699, K18742, K16431, K16292, and K16460). (B) Pericentric localization of Wapl-GFP in live cells expressing Smc3-Scc1 fusion protein (K19495). (C) Fusion of Smc3 to Scc1, but not Scc1 to Smc1, reduces turnover of pericentric cohesin (arrows). Dynamics of pericentric Smc3-Scc1-GFP fusion proteins in wild-type ECO1 (K19176) or eco1Δ (K19377) cells, of Smc1-GFP in eco1Δ Smc3-Scc1 long-linker fusion (K19491) cells, and of Smc3-GFP in eco1-1 Scc1-Smc1 fusion (K19514) cells. Data are represented as mean difference of normalized fluorescence intensity between unbleached and bleached clusters ± SEM. n = the number of cells examined. Sister-centromere clusters are marked by Mtw1RFP. See also Figure S7 for normalized fluorescence intensity unbleached and bleached regions. (D) Wapl induction during G2/M destroys cohesion in eco1Δ cells (K18943) but not in eco1Δ cells expressing an Smc3-Scc1 fusion protein (K19129). Minichromosome cohesion assay as described for Figure 1B. Brackets denote percentages of DNAs in dimer fractions.
Figure 7
Figure 7
A Model: Acetylation of Smc3 NBDs by Eco1 Prevents Transient Dissociation of the Smc3/Kleisin Interface and Thereby Blocks Escape of DNAs Scc1 synthesis in late G1 leads to cohesin’s loading onto chromatin due to transient opening of its hinge domains by Kollerin (Scc2/4). Wapl acts with Pds5, Scc3, and Smc3 NBDs to release DNA from cohesin rings by opening the Smc3/α-kleisin interface. Free cohesin molecules are reloaded onto DNA. During S phase, acetylation on Smc3 (K112 and K113) by Eco1 prevents dissociation of the Smc3/α-kleisin interface and thereby maintains sister DNAs inside cohesin rings.
Figure S1
Figure S1
Subnuclear Localization of Cohesin Subunits Depends on α-Kleisin, Related to Figure 2 (A) Live-cell imaging showing the localization of Pds5-GFP at ribosomal DNA regions marked by Net1RFP (K18329). (B) The subnuclear localization of Wapl (K18848), Pds5 (K17373) and Scc3 (K17749) is dependent on Scc1. Endogenous Scc1 is under the control of GAL inducible promoter. Live-cell imaging was performed before and after switching from galactose to glucose for 1.5 hr at 25°C.
Figure S2
Figure S2
Dynamics of Cohesin and Its Regulatory Subunits in Wild-Type Tetraploids and eco1-1 Diploids, Related to Figure 3 (A) Normalized fluorescence intensity of the unbleached, bleached regions and of the whole nuclei in wild-type tetraploids expressing WaplGFP (K18804). (B) Normalized fluorescence intensity of the unbleached and bleached centromere clusters in eco1-1 diploids expressing WaplGFP (K18420). (C) Normalized fluorescence intensity of the unbleached and bleached halves of barrel in wild-type tetraploids expressing Pds5GFP (K18407). (D) Same as (B), except normalized Pds5GFP intensity is shown (K18419). (E) Same as (C), except normalized Scc1GFP intensity is shown (K18246). (F) Same as (B), except normalized Smc3GFP intensity is shown over an extended period after photobleaching (K18454). Data are represented as mean normalized fluorescence intensity (to prebleaching regions) ± SEM. n = the number of cells examined.
Figure S3
Figure S3
The Effect of wpl1Δ on Cohesin Turnover and on the Amounts of Pericentric Cohesin in eco1-1 Diploids at Restrictive Temperature, Related to Figure 4 (A and B) Normalized Smc3GFP intensity of unbleached and bleached centromere foci in eco1-1 (A, K18454) and eco1-1 wpl1Δ (B, K18784) diploids. (C and D) Normalized Smc3(E1155Q)GFP intensity of unbleached and bleached centromere clusters in eco1-1 (C, K19362) and eco1-1 wpl1Δ (D, K19037). Data are represented as mean normalized fluorescence intensity (to prebleaching regions) ± SEM. n = the number of cells examined. (E) Representative images showing pericentric Scc1GFP in eco1-1 (K18337, Mtw1RFP: –ve) and eco1-1 wpl1Δ (K19255, Mtw1RFP: +ve) diploids. Live-cell imaging was performed on the same slides after cells preincubated at restrictive temperature for 1.5 hr to inactivate eco1. (F) Quantitation of the relative pericentric Scc1GFP intensity in (E).
Figure S4
Figure S4
Live-Cell Imaging of the Expression and Localization of Scc1GFP after Pheromone Release to “Late G1” Arrest, Related Figure 4D (A) Wild-type cells (K19134) expressing Scc1GFP and Mtw1RFP were arrested in α-factor for 3.5 hr. Gal1p-Sic1(9 m) was overexpressed (right) or not (left) for 2 hr before pheromone release by addition of galactose. Live-cell imaging was performed at indicated time points. (B) Same as (A) except using wpl1Δ cells (K19137).
Figure S5
Figure S5
FLIP Analysis of Pericentric Cohesin in “Late G1” Arrested Wild-Type and wpl1Δ Diploid Cells, Related to Figure 4D (A and B) FLIP analysis showed the normalized Scc1GFP and Mtw1RFP fluorescence intensity in wild-type (A, K19295) and wpl1Δ (B, K19297). Cells were arrested in α-factor for 2.5 hr. Sic1(9 m) protein was overexpressed for 1 hr before pheromone release. FLIP was performed after 60 min in “late G1” arrest. FACS profiles were shown on right. Data are represented as mean normalized fluorescence intensity (to prebleaching regions) ± SEM. n = the number of cells examined.
Figure S6
Figure S6
The Effect of Antiestablishment Mutations on Cohesin Turnover in eco1-1 Diploids at Restrictive Temperature, Related to Figure 5 (A–D) Normalized cohesin fluorescence intensity of unbleached and bleached centromere clusters in eco1-1 (A, K18402) and in eco1-1 diploids containing Smc3S75R (B, K19306), Pds5A88P (C, K19066) and Scc3E202K (D, K19203). Data are represented as mean normalized fluorescence intensity (to prebleaching regions) ± SEM. n = the number of cells examined.
Figure S7
Figure S7
The Effect of Smc-Scc1 Fusion on Viability and Cohesin Dynamics in ECO1+ and eco1Δ Cells, Related to Figure 6C (A) Cells expressing the Smc3-Scc1 fusion protein rescue eco1Δ lethality. eco1-1 (K18565) or eco1Δ cells with indicated Smc-Scc1 fusion proteins (K16292, K16460, K19313, K19463, K19221, and K19500) or wpl1Δ (K16431) were grown on YEPD plates at restrictive temperature (35.5°C). (B–D) Dynamics of pericentric Smc3-Scc1-GFP fusion proteins in ECO1+ (B, K19176) or Δeco1 (C, K19377) cells, and pericentric Smc1-GFP in Δeco1 Smc3-Scc1 long-linker fusion (D, K19491) cells. Data are represented as mean normalized fluorescence intensity (to prebleaching regions) ± SEM. n = the number of cells examined.

References

    1. Arumugam P., Gruber S., Tanaka K., Haering C.H., Mechtler K., Nasmyth K. ATP hydrolysis is required for cohesin’s association with chromosomes. Curr. Biol. 2003;13:1941–1953. - PubMed
    1. Beckouët F., Hu B., Roig M.B., Sutani T., Komata M., Uluocak P., Katis V.L., Shirahige K., Nasmyth K. An Smc3 acetylation cycle is essential for establishment of sister chromatid cohesion. Mol. Cell. 2010;39:689–699. - PMC - PubMed
    1. Ciosk R., Shirayama M., Shevchenko A., Tanaka T., Toth A., Shevchenko A., Nasmyth K. Cohesin’s binding to chromosomes depends on a separate complex consisting of Scc2 and Scc4 proteins. Mol. Cell. 2000;5:243–254. - PubMed
    1. Farcas A.M., Uluocak P., Helmhart W., Nasmyth K. Cohesin’s concatenation of sister DNAs maintains their intertwining. Mol. Cell. 2011;44:97–107. - PMC - PubMed
    1. Gandhi R., Gillespie P.J., Hirano T. Human Wapl is a cohesin-binding protein that promotes sister-chromatid resolution in mitotic prophase. Curr. Biol. 2006;16:2406–2417. - PMC - PubMed

Publication types

MeSH terms

Substances