. 2012 Aug 17;150(4):685-96.
doi: 10.1016/j.cell.2012.07.018.

PKM2 phosphorylates histone H3 and promotes gene transcription and tumorigenesis

Affiliations

PKM2 phosphorylates histone H3 and promotes gene transcription and tumorigenesis

Weiwei Yang et al. Cell. .

Erratum in

  • Cell. 2014 Aug 28;158(5):1210

Abstract

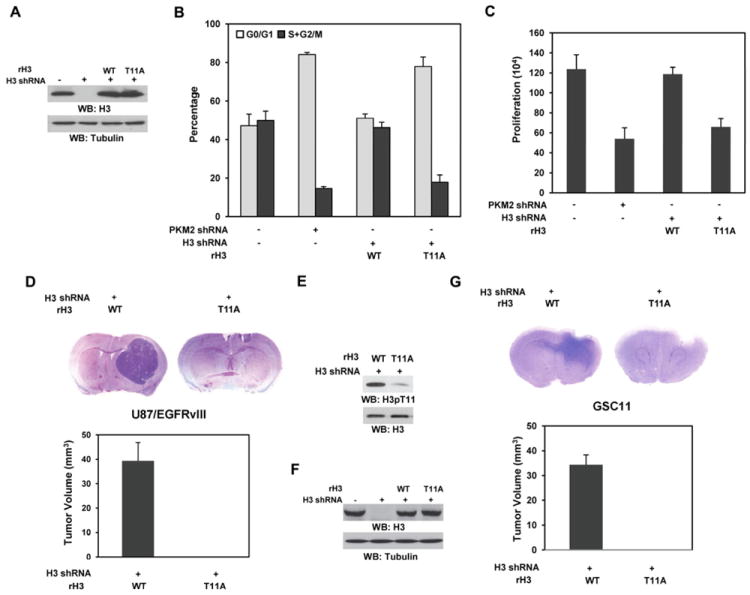
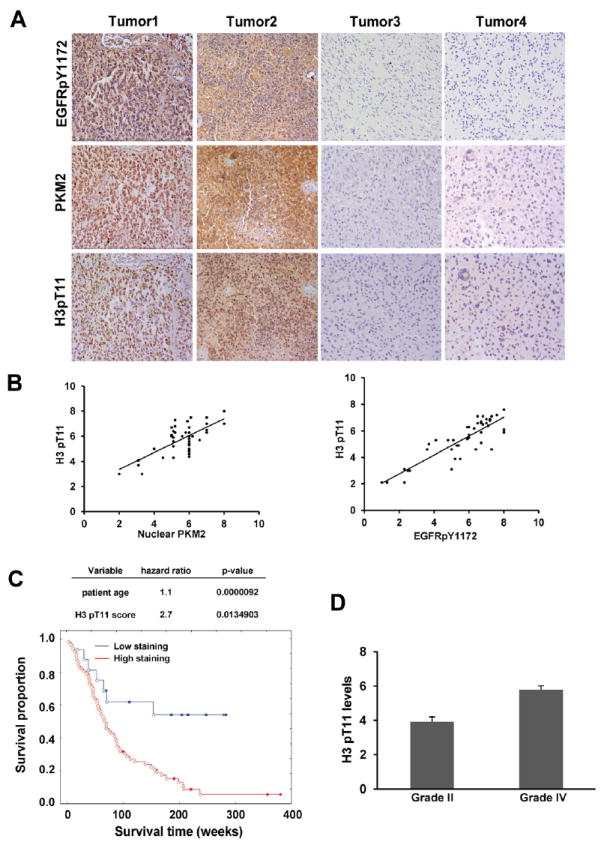
Tumor-specific pyruvate kinase M2 (PKM2) is essential for the Warburg effect. In addition to its well-established role in aerobic glycolysis, PKM2 directly regulates gene transcription. However, the mechanism underlying this nonmetabolic function of PKM2 remains elusive. We show here that PKM2 directly binds to histone H3 and phosphorylates histone H3 at T11 upon EGF receptor activation. This phosphorylation is required for the dissociation of HDAC3 from the CCND1 and MYC promoter regions and subsequent acetylation of histone H3 at K9. PKM2-dependent histone H3 modifications are instrumental in EGF-induced expression of cyclin D1 and c-Myc, tumor cell proliferation, cell-cycle progression, and brain tumorigenesis. In addition, levels of histone H3 T11 phosphorylation correlate with nuclear PKM2 expression levels, glioma malignancy grades, and prognosis. These findings highlight the role of PKM2 as a protein kinase in its nonmetabolic functions of histone modification, which is essential for its epigenetic regulation of gene expression and tumorigenesis.


Figures

Figure 1
Figure 1. EGF-Induced and PKM2-Dependent Phosphorylation of Histone H3 at T11 Is Required for Acetylation of Histone H3 at K9
Please also see supplemental Figures S1-S4. Immunoprecipitation and immunoblotting analyses were performed with the indicated antibodies. (A) U87/EGFR cells expressing Flag-tagged WT H3, H3-K4R, and K9R were treated with or without EGF (100 ng/ml) for 6 h. (B, F) U87/EGFR and U251 cells expressing a control or PKM2 shRNA were treated with or without EGF (100 ng/ml) for 6 h. Endogenously expressed histone H3 was examined. Data represent the mean ± SD of three independent experiments (F). (C) U87/EGFR were treated with or without EGF (100 ng/ml) or 20% serum with calyculin A (25 nM) for 6 h. (D) U87/EGFR cells with or without expressing PKM2 shRNA were treated with or without EGF (100 ng/ml) for 6 h. Endogenously expressed histone H3 was immunoprecipitated. (E) U87/EGFR cells expressing Flag-tagged WT H3, H3-T3A, H3-T6A, and H3-T11A were treated with or without EGF (100 ng/ml) for 6 h. (G) U87/EGFR cells expressing Flag-tagged WT H3 or H3-T11A were treated with or without EGF (100 ng/ml) for 6 h. (H) U87/EGFR cells expressing a control shRNA or shRNA against Chk1, DAPK3, or PKN1 mRNA were analyzed by immunoblotting analysis with the indicated antibodies. (I) U87/EGFR cells expressing a control shRNA or shRNA against Chk1, DAPK3, or PKN1 mRNA were treated with or without EGF (100 ng/ml) for 6 h and analyzed by immunoblotting analysis with the indicated antibodies.
Figure 2
Figure 2. PKM2 Directly Interacts with Histone H3 and Phosphorylates H3-T11
Please also see supplemental Figures S5A and S5B. Immunoprecipitation and immunoblotting analyses were performed with the indicated antibodies. (A) Pull-down analyses were performed by mixing purified immobilized His-PKM2 on nickel agarose beads with purified non-tagged recombinant histone H3 or histone H2A. (B) U87/EGFR cells were treated with or without EGF (100 ng/ml) for 6 h. (C) In vitro phosphorylation was analyzed by mixing recombinant WT PKM2, PKM2 K367M, or PKM1 with purified recombinant WT H3 or H3-T11A in the presence of PEP or ATP. (D) Purified recombinant His-histone H3 was phosphorylated by PKM2 in vitro and was analyzed by mass spectrometry. Mass spectrometric analysis of a tryptic fragment at m/z 533.258 (mass error was -0.98 ppm) matched to the doubly-charged peptide 9-KSTGGKAPR-17, suggesting that T11 was phosphorylated. The Sequest score for this match was Xcorr = 2.74; Mascot scores were 46, expectation value 5.1e-4. The pRS score was 116, site probability was 99.1%. The presence of the b2+ ion at 258.2 indicates the S10 residue is unmodified; the presence of the y7+ at 808.2 is in agreement with the assignment of the phosphorylation site to T11. (E, F) U87/EGFR cells expressing PKM2 shRNA were reconstituted by the expression of WT rPKM2, rPKM2 K367M, or rPKM2 K433E (E) and treated with or without EGF (100 ng/ml) for 6 h (F).
Figure 3
Figure 3. PKM2-Dependent H3-T11 Phosphorylation Promotes the Disassociation of HDAC3 from CCND1 and MYC Promoter
Please also see supplemental Figure S5C. Immunoblotting analyses were performed with the indicated antibodies. (A, B) WT rH3 or rH3-T11A expression was reconstituted in endogenous H3-depleted U87/EGFR cells (A), which were then treated with or without EGF (100 ng/ml) for 6 h. ChIP analyses with a HDAC3 antibody were performed (B). (C) GST-HDAC3 pull-down assay was performed by incubation of 100 ng of purified recombinant His-tagged WT histone H3 or H3-T11A mutant with or without immobilized GST-HDAC3, which was followed by incubation with 200 ng of purified recombinant WT His-PKM2 or His-PKM2 K367M in the presence of PEP.
Figure 4
Figure 4. PKM2-Dependent H3-T11 Phosphorylation Promotes EGF-Induced Expression of Cyclin D1 and c-Myc
Please also see supplemental Figure S6. Immunoprecipitation, immunoblotting, and ChIP analyses were performed with the indicated antibodies. (A) U87/EGFR cells with or without depletion of endogenous PKM2 and reconstituted expression of WT rPKM2 or rPKM2 K367M were treated with or without EGF (100 ng/ml) for 10 h. (B) 293T cells with or without expressing Flag-tagged WT H3 or H3-T11A were treated with EGF (100 ng/ml) for 6 h. (C, D, E) U87/EGFR cells with depleted endogenous histone H3 and reconstituted expression of WT rH3 or rH3-T11A were treated with or without EGF (100 ng/ml) for 10 h. ChIP analyses were performed with an anti-PKM2 (C) or an anti-acetyl-H3K9 antibody (D). (E) Quantitative real time polymerase chain reaction (PCR) was performed with specific primers for CCND1 (left panel) or MYC mRNA (right panel). Data represent the mean ± SD of three independent experiments. (F) U87/EGFR cells with depleted endogenous histone H3 and reconstituted expression of WT rH3, rH3-T11A, or rH3-K9R were treated with or without EGF (100 ng/ml) for 6 h for detection of H3 acetylation or 24 h for examination of cyclin D1 and c-Myc expression. (G) U87/EGFR cells with endogenous PKM2 depletion and reconstituted expression of WT rPKM2 or rPKM2 K367M were treated with or without EGF (100 ng/ml) for 24 h.
Figure 5
Figure 5. PKM2-Dependent H3-T11 Phosphorylation Is Required for Cell Cycle Progression, Cell Proliferation, and Tumor Development
Please also see supplemental Figure S7. (A) WT rH3 or rH3-T11A expression was reconstituted in U87/EGFRvIII cells with depleted endogenous H3. Immunoblotting analyses were performed with the indicated antibodies. (B) U87/EGFRvIII cells with depleted PKM2 or endogenous H3 and reconstituted expression of WT rH3 or rH3-T11A were stained with propidium iodide and analyzed for DNA staining profiles by flow cytometry. Data represent the mean ± SD of three independent experiments. (C) A total number of 2 × 10⁴ U87/EGFRvIII cells with depleted PKM2 or endogenous H3 and reconstituted expression of WT rH3 or rH3-T11A were plated and counted 7 days after seeding in DMEM with 2% bovine calf serum. Data represent the mean ± SD of three independent experiments. (D, E, F, G) A total of 5 × 10⁵ endogenous histone H3–depleted U87/EGFRvIII (D, E) or GSC11 (F, G) cells with reconstituted expression of WT rH3 or rH3-T11A were intracranially injected into athymic nude mice for each group. The mice were sacrificed and examined for tumor growth. H&E-stained coronal brain sections show representative tumor xenografts. Tumor volumes were measured by using length (a) and width (b) and calculated using the equation: V = ab2/2. Data represent the means ± SD of seven mice. (E) Immunoblotting analysis with anti–phospho-H3-T11 antibody was performed on lysates of the tumor tissue derived from the mice injected with U87/EGFvIII cells with reconstituted expression of WT histone H3 and the counterpart tissue derived form the mice injected with U87/EGFvIII cells with reconstituted expression of histone H3 T11A mutant. (F) WT rH3 or rH3-T11A expression was reconstituted in GSC11 cells with depleted endogenous H3. Immunoblotting analyses were performed with the indicated antibodies.
Figure 6
Figure 6. H3-T11 Phosphorylation Positively Correlates with the Level of Nuclear PKM2 Expression and with Grades of Glioma Malignancy and Prognosis
(A, B) Immunohistochemical staining with anti–phospho-EGFR Y1172, anti–phospho-H3-T11, and anti-PKM2 antibodies was performed on 45 GBM specimens. Representative photos of four tumors are shown (A). Semiquantitative scoring was performed (Pearson product moment correlation test; r = 0.704, p < 0.0001, left panel; r = 0.86, p < 0.001, right panel). Note that some of the dots on the graphs represent more than one specimen (some scores overlapped) (B). (C) The survival times for 85 patients with low (0-4 staining scores, blue curve) versus high (4.1-8 staining scores, red curve) H3-T11 phosphorylation (low, 16 patients; high, 69 patients) were compared. The table (top panel) shows the multivariate analysis after adjustment for patient age, indicating the significance level of the association of H3-T11 phosphorylation (p = 0.01349038) with patient survival. Empty circles represent deceased patients, and filled circles represent censored (alive at last clinical follow-up) patients. (D) Thirty diffuse astrocytoma specimens were immunohistochemically stained with anti–phospho-H3-T11 antibody, and specimens were compared with 45 stained GBM specimens (Student’s t test, two tailed, p < 0.001). Data represent the mean ± SD of and 30 stained astrocytoma specimens and 45 stained GBM specimens.
Figure 7
Figure 7. PKM2 regulates gene expression by H3-T11 Phosphorylation
EGFR activation results in nuclear translocation of PKM2 that binds to gene promoter regions, where PKM2 phosphorylates H3-T11, leading to HDAC3 disassociation from the promoters and subsequent acetylation of histone H3, transcription of genes, cell cycle progression, and cell proliferation.

Comment in

  • Proliferation: Multitasking.
    McCarthy N. McCarthy N. Nat Rev Cancer. 2012 Oct;12(10):660-1. doi: 10.1038/nrc3374. Epub 2012 Sep 21. Nat Rev Cancer. 2012. PMID: 22996599 No abstract available.

References

    1. Altenberg B, Greulich KO. Genes of glycolysis are ubiquitously overexpressed in 24 cancer classes. Genomics. 2004;84:1014–1020. - PubMed
    1. Baek SH. When signaling kinases meet histones and histone modifiers in the nucleus. Mol Cell. 2011;42:274–284. - PubMed
    1. Cairns RA, Harris IS, Mak TW. Regulation of cancer cell metabolism. Nat Rev Cancer. 2011;11:85–95. - PubMed
    1. Christofk HR, Vander Heiden MG, Harris MH, Ramanathan A, Gerszten RE, Wei R, Fleming MD, Schreiber SL, Cantley LC. The M2 splice isoform of pyruvate kinase is important for cancer metabolism and tumour growth. Nature. 2008a;452:230–233. - PubMed
    1. Christofk HR, Vander Heiden MG, Wu N, Asara JM, Cantley LC. Pyruvate kinase M2 is a phosphotyrosine-binding protein. Nature. 2008b;452:181–186. - PubMed

Publication types

MeSH terms