. 2012 Aug 17;150(4):842-54.
doi: 10.1016/j.cell.2012.07.023.

Cancer vulnerabilities unveiled by genomic loss

Affiliations

Cancer vulnerabilities unveiled by genomic loss

Deepak Nijhawan et al. Cell. .

Abstract

Due to genome instability, most cancers exhibit loss of regions containing tumor suppressor genes and collateral loss of other genes. To identify cancer-specific vulnerabilities that are the result of copy number losses, we performed integrated analyses of genome-wide copy number and RNAi profiles and identified 56 genes for which gene suppression specifically inhibited the proliferation of cells harboring partial copy number loss of that gene. These CYCLOPS (copy number alterations yielding cancer liabilities owing to partial loss) genes are enriched for spliceosome, proteasome, and ribosome components. One CYCLOPS gene, PSMC2, encodes an essential member of the 19S proteasome. Normal cells express excess PSMC2, which resides in a complex with PSMC1, PSMD2, and PSMD5 and acts as a reservoir protecting cells from PSMC2 suppression. Cells harboring partial PSMC2 copy number loss lack this complex and die after PSMC2 suppression. These observations define a distinct class of cancer-specific liabilities resulting from genome instability.


Figures

Figure 1
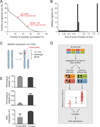
Figure 1. Identification of CYCLOPS genes
A. The percentage of the cancer genome involved in copynumber loss. B. The fraction of deleted regions associated with deletion events of varying lengths. C. Biallelic inactivation of a tumor suppressor is often associated with a focal alteration of one copy (red bar) and hemizygous loss of all genes on the chromosome arm containing the other copy. D. Schematic describing the approach to identifying CYCLOPS genes. For each gene, we separated cell lines with and without loss of the gene and compared their dependency on that gene by permuting class labels. E. Frequency of hemizygous deletion, homozygous deletion, or DNA methylation of CYCLOPS and other genes. Data are presented as averages ± S.E.M. See also Figure S1 and Table S1–3.
Figure 2
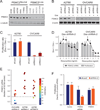
Figure 2. PSMC2Loss cells are sensitive to PSMC2 suppression
A. Comparison of gene dependence between three models of oncogene addiction and PSMC2. Cell lines were classified by mutation status for PIK3CA, BRAF, or KRAS (n=102 in each case) or PSMC2 copy-number (n=84). For each class, gene dependency scores reflect the sensitivity to the gene on which the categorization was based. Solid bars represent average scores. B. The effect of PSMC2 suppression on the proliferation of six ovarian cell lines. C. PSMC2 levels (left) and relative proliferation rates (right) among cells expressing different combinations of PSMC2 shRNA targeting the 3’ UTR and ectopic V5-PSMC2 expression. Data are presented as averages ± S.D. See also Figure S2 and Table S4–5.
Figure 3
Figure 3. Threshold requirement for PSMC2
A. PSMC2 levels among ovarian cancer cell lines. B. PSMC2 levels in cells that express an inducible shRNA that targets either PSMC2 or LacZ. C. Effects of PSMC2 suppression on proliferation. D. Relationship between PSMC2 mRNA expression and proliferation in PSMC2Neutral (left) and PSMC2Loss (right) cells. Data represents averages ± S.D. E. Schematic combining data from Fig 3D and S3D–E indicates that A2780 and OVCAR8 cells share a similar absolute threshold requirement for PSMC2 (dashed line). F. Cellular proliferation in A2780 cells with and without PSMC2 suppression after introduction of control, PSMC2, or PSMC5 siRNAs. Data are presented as averages +/− S.E.M. See also Figure S3 and Table S6.
Figure 4
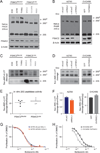
Figure 4. PSMC2Loss cells lack a PSMC2 reservoir
A. Total PSMC2 levels (top) and Native PAGE immunoblot for PSMA1-6 (middle) in PSMC2Neutral and PSMC2Loss cells. B. Native PAGE immunoblot for PSMA1-6 in A2780 (left) and OVCAR8 (right) after inducible suppression or ectopic expression of PSMC2, respectively. C. Native PAGE 26S and 20S peptidase cleavage in PSMC2Neutral and PSMC2Loss cells. D. Native PAGE 26S and 20S peptidase cleavage in isogenic systems used in B. E. In vitro 26S proteasome activities in PSMC2Neutral and PSMC2Loss cells. Each point represents a cell line; dashed lines represent averages. F. In vitro 26S proteasome activities in isogenic systems used in B and D. G-H. Dose response curve for bortezomib in (G) A2780 cells with and without PSMC2 suppression and (H) OVCAR8 with and without ectopic V5-PSMC2 expression. See also Figure S4 and Table S7.
Figure 5
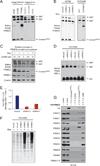
Figure 5. Complex PSMC2 buffers PSMC2Neutral cells against PSMC2 suppression
A. Native PAGE immunoblot for PSMC2 across a panel of PSMC2Neutral and PSMC2Loss cells. B. Native PAGE immunoblot for PSMC2 in OVCAR8 and A2780 after ectopic expression or inducible suppression, respectively, of PSMC2. C. Quantification of 26S proteasome and ComplexPSMC2 levels after PSMC2 suppression in DoxshRNA- 2 A2780 cells by Native PAGE (top) and total PSMC2 levels (bottom). The four left lanes represent a standard curve derived from dilutions of lysate from cells cultured without doxycycline. 26Sproteasome and ComplexPSMC2 bands are shown at different exposures. D-F. OVCAR8 cells with and without PSMC2 suppression analyzed by Native PAGE immunoblots for (D) PSMA1-6 and (E) peptidase cleavage in lysates, and (F) total poly-ubiquitin levels (See also Fig S5A-B). G. ComplexPSMC2 contains PSMC2, PSMC1, PSMD2, and PSMD5. Immunoblots for 19S complex components in V5 immune complexes isolated from fractions (See also Fig S5C-D). See also Figure S5.
Figure 6
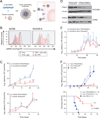
Figure 6. Tumor-penetrating nanocomplex-mediated delivery of PSMC2-specific siRNA suppresses ovarian tumor growth
A. Schematic depicting the mechanism of tumor-penetrating nanocomplex (TPN)-mediated delivery of siRNA. B. Comparison of cellular uptake of fluorescently labeled siRNA in untreated cells (solid grey) and cells treated with TPN alone (black line) and in combination with IgG (grey line) or an antibody to p32 (solid pink). C. Tumor burden of mice bearing disseminated OVCAR8 (top) or A2780 (bottom) orthotopic xenografts treated with TPN carrying either GFP-siRNA or PSMC2-siRNA. n=5 animals per group. D. PSMC2 levels in orthotopic tumors of A2780 or OVCAR8 after treatment with nanoparticles carrying siGFP or siPSMC2. E. Tumor burden of mice bearing orthotopic tumors of OVCAR8 cells expressing V5-PSMC2. n =5 animals per group. F. Tumor burden (top) and overall survival (bottom) of mice bearing orthotopic tumors of A2780 cells expressing doxycycline-inducible shRNA against PSMC2. n = 5–13 animals per group. Data in all panels presented as average ± S.E.M. Significance was determined by one-way ANOVA or Log-rank (Mantel-Cox) tests as appropriate. n.s. = not significant; *p<0.05; **p<0.01; ***p<0.001; ****p<0.0001. See also Figure S6.

References

    1. Aghajanian C, Soignet S, Dizon DS, Pien CS, Adams J, Elliott PJ, Sabbatini P, Miller V, Hensley ML, Pezzulli S, et al. A phase I trial of the novel proteasome inhibitor PS341 in advanced solid tumor malignancies. Clinical cancer research : an official journal of the American Association for Cancer Research. 2002;8:2505–2511. - PubMed
    1. Ashworth A, Lord CJ, Reis-Filho JS. Genetic interactions in cancer progression and treatment. Cell. 2011;145:30–38. - PubMed
    1. Barretina J, Caponigro G, Stransky N, Venkatesan K, Margolin AA, Kim S, Wilson CJ, Lehar J, Kryukov GV, Sonkin D, et al. The Cancer Cell Line Encyclopedia enables predictive modelling of anticancer drug sensitivity. Nature. 2012;483:603–607. - PMC - PubMed
    1. Bell D, Berchuck A, Birrer M, Chien J, Cramer DW, Dao F, Dhir R, DiSaia P, Gabra H, Glenn P, et al. Integrated genomic analyses of ovarian carcinoma. Nature. 2011;474:609–615. - PMC - PubMed
    1. Benjamini Y, Hochberg Y. Controlling the False Discovery Rate - A Practical and Powerful Approach to Multiple Testing. J R Stat Soc Ser B-Methodol. 1995;57:289–300.

Publication types

Substances