RETRACTED: Cardiac-specific overexpression of catalase attenuates lipopolysaccharide-induced myocardial contractile dysfunction: Role of autophagy
- PMID: 22902401
- PMCID: PMC3495589
- DOI: 10.1016/j.freeradbiomed.2012.07.084
RETRACTED: Cardiac-specific overexpression of catalase attenuates lipopolysaccharide-induced myocardial contractile dysfunction: Role of autophagy
Retraction in
-
Retraction notice to "Cardiac-specific overexpression of catalase attenuates lipopolysaccharide-induced myocardial contractile dysfunction: Role of autophagy" [Free Radic. Biol. Med. 53/6 (2012) 1327-1338].Free Radic Biol Med. 2022 Aug 20;189:178. doi: 10.1016/j.freeradbiomed.2022.07.011. Epub 2022 Aug 1. Free Radic Biol Med. 2022. PMID: 35927165 Free PMC article.
Abstract
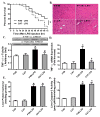
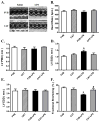
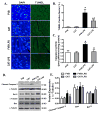
This article has been retracted: please see Elsevier Policy on Article Withdrawal (http://www.elsevier.com/locate/withdrawalpolicy). This article has been retracted at the request of the Editor-in-Chief. After an institutional investigation into the work of Dr. Jun Ren, University of Wyoming subsequently conducted an examination of other selected publications of Dr. Ren's under the direction of the HHS Office of Research Integrity. Based on the findings of this examination, the University of Wyoming recommended this article be retracted due to concerns regarding data irregularities inconsistent with published conclusions. Specifically, University of Wyoming found evidence of data irregularities and image reuse in Figure 2 that significantly affect the results and conclusions reported in the manuscript.
Copyright © 2012 Elsevier Inc. All rights reserved.
Figures



Similar articles
-
Retraction notice to "Cardiac-specific overexpression of catalase attenuates lipopolysaccharide-induced myocardial contractile dysfunction: Role of autophagy" [Free Radic. Biol. Med. 53/6 (2012) 1327-1338].Free Radic Biol Med. 2022 Aug 20;189:178. doi: 10.1016/j.freeradbiomed.2022.07.011. Epub 2022 Aug 1. Free Radic Biol Med. 2022. PMID: 35927165 Free PMC article.
-
RETRACTED: Akt2 knockout alleviates prolonged caloric restriction-induced change in cardiac contractile function through regulation of autophagy.J Mol Cell Cardiol. 2014 Jun;71:81-91. doi: 10.1016/j.yjmcc.2013.12.010. Epub 2013 Dec 22. J Mol Cell Cardiol. 2014. Retraction in: J Mol Cell Cardiol. 2023 Apr;177:63. doi: 10.1016/j.yjmcc.2023.03.005. PMID: 24368095 Free PMC article. Retracted.
-
RETRACTED: Phytoestrogen alpha-zearalanol inhibits homocysteine-induced endothelin-1 expression and oxidative stress in human umbilical vein endothelial cells.Atherosclerosis. 2008 Apr;197(2):549-55. doi: 10.1016/j.atherosclerosis.2007.08.018. Epub 2007 Sep 27. Atherosclerosis. 2008. PMID: 17900592 Retracted.
-
RETRACTED: Maternal nutrient restriction predisposes ventricular remodeling in adult sheep offspring.J Nutr Biochem. 2013 Jul;24(7):1258-65. doi: 10.1016/j.jnutbio.2012.10.001. Epub 2013 Jan 17. J Nutr Biochem. 2013. Retraction in: J Nutr Biochem. 2023 Feb;112:109243. doi: 10.1016/j.jnutbio.2022.109243. PMID: 23333094 Free PMC article. Retracted.
-
RETRACTED: TRPV6 calcium channel regulation, downstream pathways, and therapeutic targeting in cancer.Cell Calcium. 2019 Jun;80:117-124. doi: 10.1016/j.ceca.2019.04.006. Epub 2019 Apr 22. Cell Calcium. 2019. Retraction in: Cell Calcium. 2020 Mar;86:102126. doi: 10.1016/j.ceca.2019.102126. PMID: 31055179 Retracted. Review.
Cited by
-
Tannic acid alleviates lipopolysaccharide‑induced H9C2 cell apoptosis by suppressing reactive oxygen species‑mediated endoplasmic reticulum stress.Mol Med Rep. 2021 Jul;24(1):535. doi: 10.3892/mmr.2021.12174. Epub 2021 Jun 3. Mol Med Rep. 2021. PMID: 34080663 Free PMC article.
-
Accelerated Autophagy of Cecal Ligation and Puncture-Induced Myocardial Dysfunction and Its Correlation with Mammalian Target of Rapamycin Pathway in Rats.Chin Med J (Engl). 2018 May 20;131(10):1185-1190. doi: 10.4103/0366-6999.231522. Chin Med J (Engl). 2018. PMID: 29722337 Free PMC article.
-
Sepsis-induced Cardiac Mitochondrial Damage and Potential Therapeutic Interventions in the Elderly.Aging Dis. 2014 Apr 1;5(2):137-49. doi: 10.14336/AD.2014.0500137. eCollection 2014 Apr. Aging Dis. 2014. PMID: 24729939 Free PMC article. Review.
-
[Correlation between uncoupling protein 2 expression and myocardial mitochondrial injury in rats with sepsis induced by lipopolysaccharide].Zhongguo Dang Dai Er Ke Za Zhi. 2016 Feb;18(2):159-64. doi: 10.7499/j.issn.1008-8830.2016.02.012. Zhongguo Dang Dai Er Ke Za Zhi. 2016. PMID: 26903064 Free PMC article. Chinese.
-
Inhibition of leukotriene B4 receptor 1 attenuates lipopolysaccharide-induced cardiac dysfunction: role of AMPK-regulated mitochondrial function.Sci Rep. 2017 Mar 14;7:44352. doi: 10.1038/srep44352. Sci Rep. 2017. PMID: 28290498 Free PMC article.
References
-
- Angus DC, Pereira CA, Silva E. Epidemiology of severe sepsis around the world. Endocr Metab Immune Disord Drug Targets. 2006;6:207–12. - PubMed
-
- Angus DC, Wax RS. Epidemiology of sepsis: an update. Crit Care Med. 2001;29:S109–S116. - PubMed
-
- Opal SM, Scannon PJ, Vincent JL, White M, Carroll SF, Palardy JE, et al. Relationship between plasma levels of lipopolysaccharide (LPS) and LPS-binding protein in patients with severe sepsis and septic shock. J Infect Dis. 1999;180:1584–9. - PubMed
-
- Ward PA. The sepsis seesaw: seeking a heart salve. Nat Med. 2009;15:497–8. - PubMed
-
- Yasuda S, Lew WYW. Lipopolysaccharide Depresses Cardiac Contractility and +/− Adrenergic Contractile Response by Decreasing Myofilament Response to Ca2+ in Cardiac Myocytes. Circ Res. 1997;81:1011–20. - PubMed
Publication types
MeSH terms
Substances
Grants and funding
LinkOut - more resources
Full Text Sources
Molecular Biology Databases
Miscellaneous

