. 2012 Aug 30;2(2):419-31.
doi: 10.1016/j.celrep.2012.07.006. Epub 2012 Aug 16.

Proteomic analysis of lysine acetylation sites in rat tissues reveals organ specificity and subcellular patterns

Affiliations

Proteomic analysis of lysine acetylation sites in rat tissues reveals organ specificity and subcellular patterns

Alicia Lundby et al. Cell Rep. .

Abstract

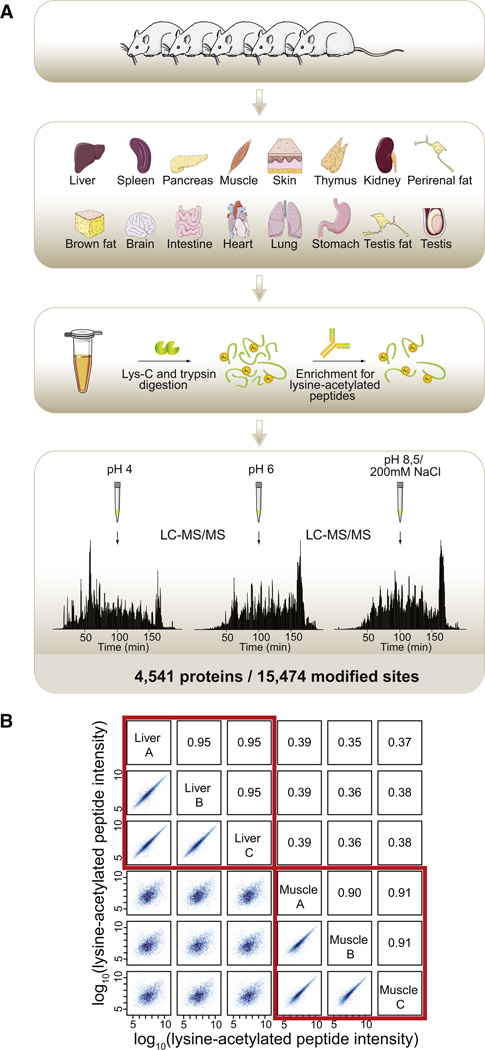
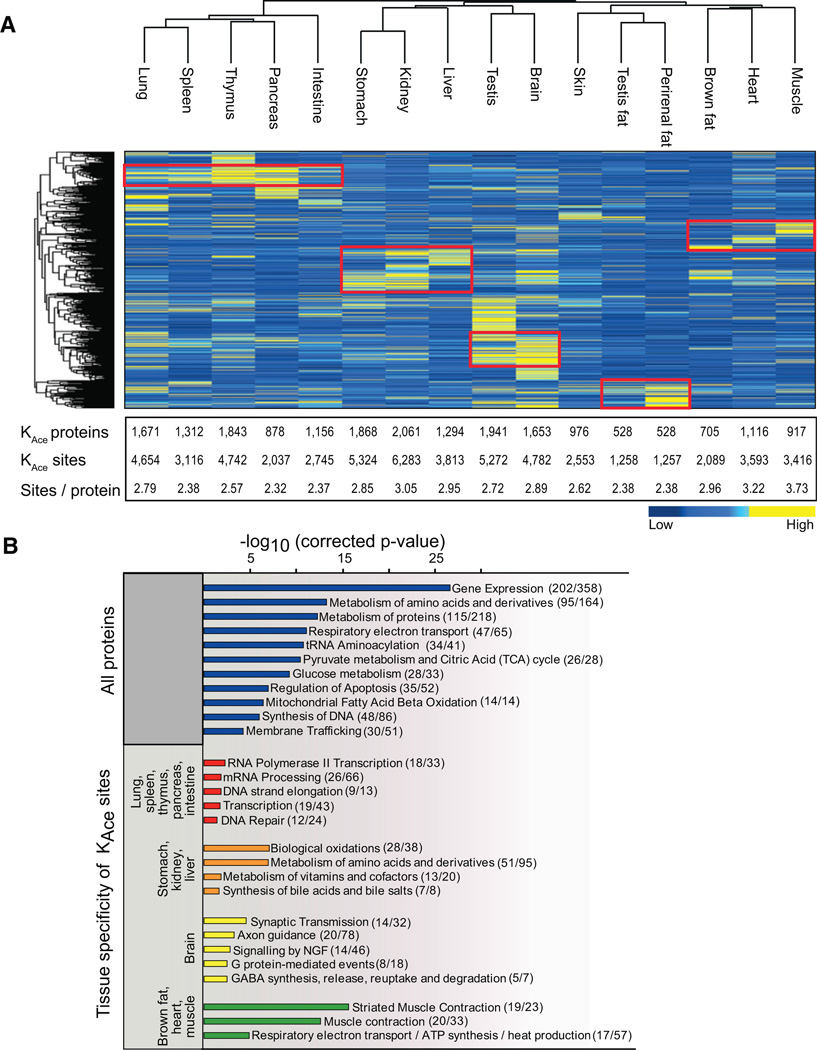
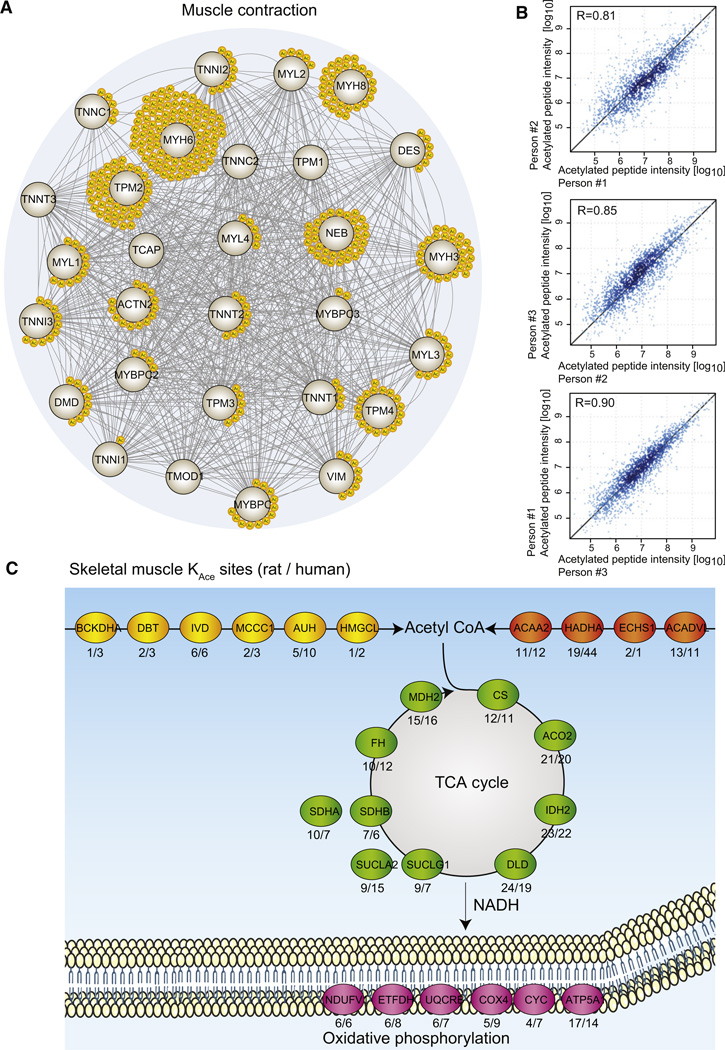
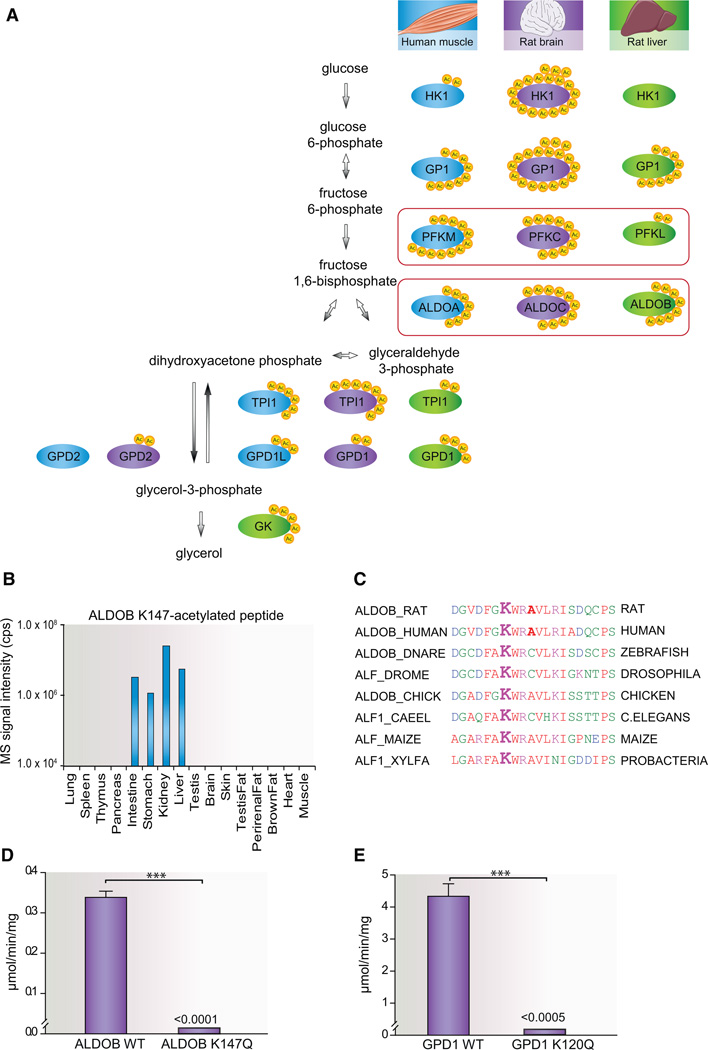
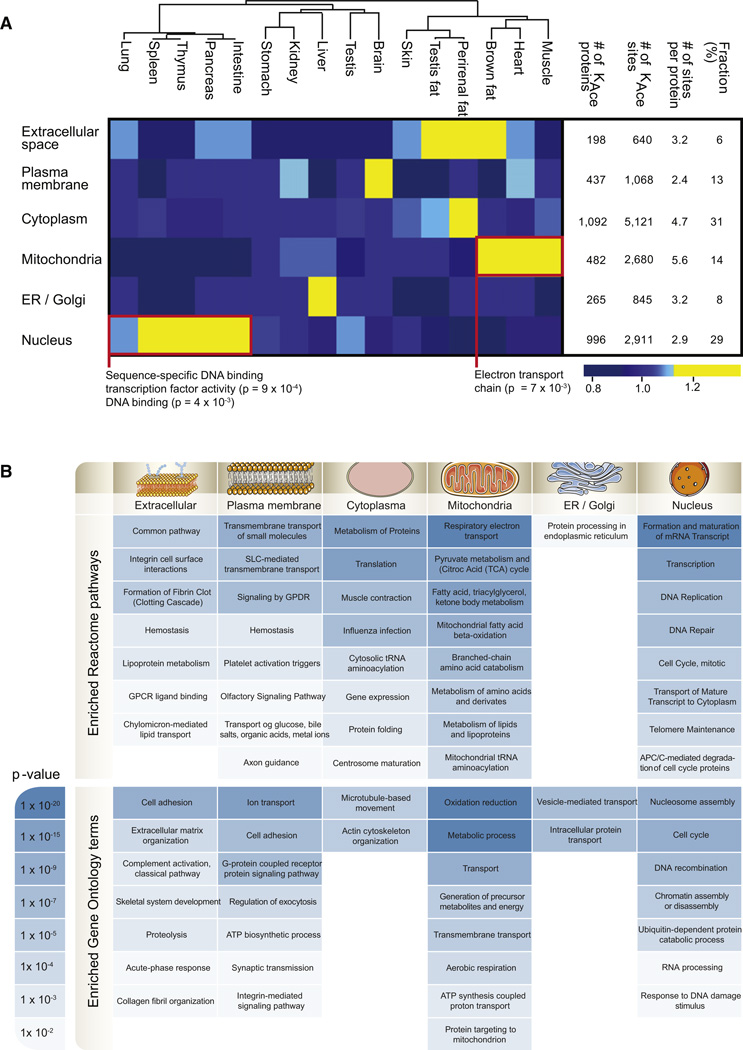
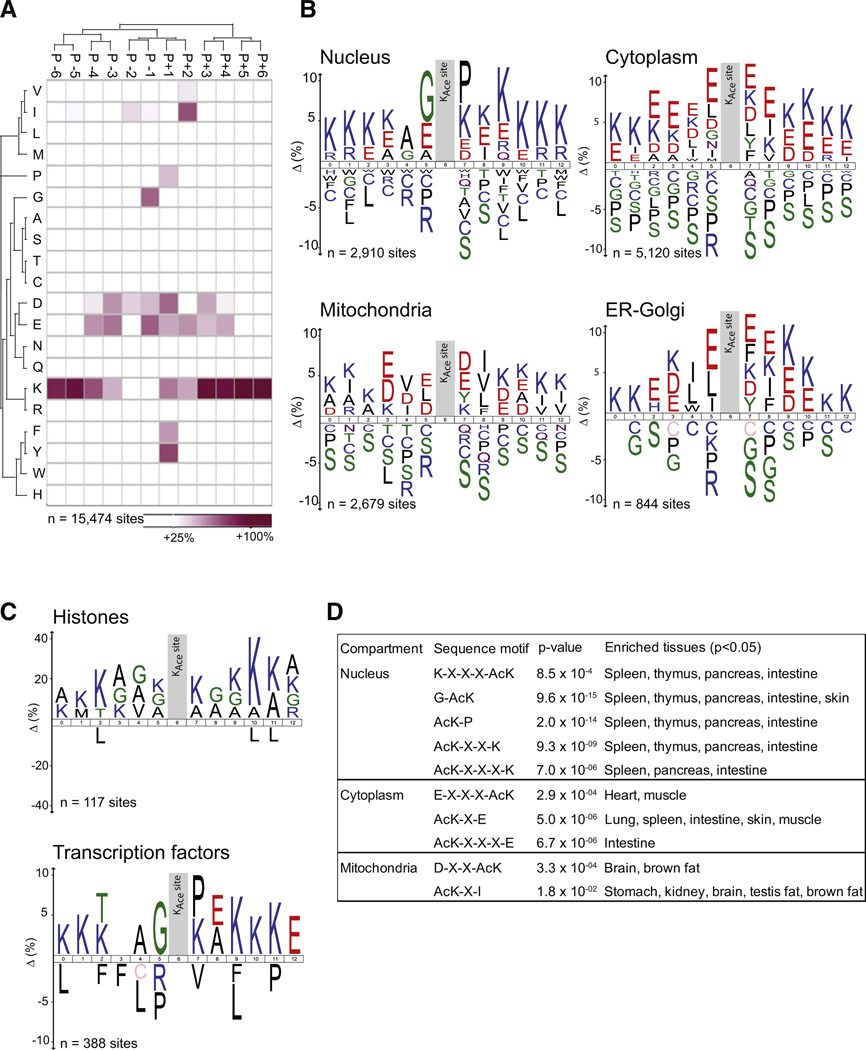
Lysine acetylation is a major posttranslational modification involved in a broad array of physiological functions. Here, we provide an organ-wide map of lysine acetylation sites from 16 rat tissues analyzed by high-resolution tandem mass spectrometry. We quantify 15,474 modification sites on 4,541 proteins and provide the data set as a web-based database. We demonstrate that lysine acetylation displays site-specific sequence motifs that diverge between cellular compartments, with a significant fraction of nuclear sites conforming to the consensus motifs G-AcK and AcK-P. Our data set reveals that the subcellular acetylation distribution is tissue-type dependent and that acetylation targets tissue-specific pathways involved in fundamental physiological processes. We compare lysine acetylation patterns for rat as well as human skeletal muscle biopsies and demonstrate its general involvement in muscle contraction. Furthermore, we illustrate that acetylation of fructose-bisphosphate aldolase and glycerol-3-phosphate dehydrogenase serves as a cellular mechanism to switch off enzymatic activity.


Figures

Figure 1
Figure 1. Workflow for Acetylome Analysis of Rat Tissues
(A) A total of 16 tissues were isolated from 5 male rats; the tissues were snap frozen, heat inactivated, homogenized, and solubilized. The extracted proteins were digested with endoproteinase Lys-C and trypsin, and lysine-acetylated peptides were enriched by immunoprecipitation. The acetylated peptide mixtures were fractionated by SCX in a STAGE tip, and three pH elutions per tissue were analyzed by high-resolution LC-MS/MS on a LTQ-Orbitrap Velos instrument resulting in identification of a total of 15,474 lysine acetylation sites from 4,541 proteins. (B) For liver and muscle samples, results from three technical replicates prepared from the tissue homogenates are shown. Logarithmized intensities for acetylated peptides were plotted against each other and shown on the left side of the diagonal with the corresponding Pearson correlation coefficients given on the right side of the diagonal. Technical replicates of the same tissue are highly correlated. See also Figures S1 and S2.
Figure 2
Figure 2. Tissue Distribution of Lysine-Acetylated Proteins
(A) Hierarchical clustering of the 16 investigated tissues and the identified acetylated proteins based on label-free quantification on their summed MS peptide signal intensities. Low-intensity proteins are depicted in blue, and high-intensity proteins are depicted in yellow. Protein clusters of highly abundant acetylated proteins are highlighted by red boxes. The table summarizes the number of lysine-acetylated proteins and sites identified in each tissue as well as the average number of acetylation sites per protein. (B) Pathway enrichment analysis for all identified acetylated proteins as well as for acetylated proteins enriched in the main tissue clusters compared to all other tissues. Logarithmized corrected p values for significant overrepresentation are shown. In parenthesis we indicate how many proteins in each pathway we identify to be acetylated. See also Figure S3.
Figure 3
Figure 3. Lysine Acetylation in Muscle Contraction
(A) All proteins associated with striated muscle contraction were extracted from the Reactome pathway database, and a protein-protein interaction network was visualized with STRING (Szklarczyk et al., 2011). Each yellow circle represents a unique lysine acetylation site identified from rat skeletal or cardiac muscle samples. (B) Correlation plots of lysine-acetylated peptide intensities from skeletal muscle samples from three human individuals. The Pearson correlation coefficient is provided in each plot. (C) Four major mitochondrial metabolic pathways are depicted with the most acetylated protein identified in skeletal muscle for each enzymatic step in the pathways. The metabolic pathways of amino acid catabolism and fatty acid metabolism generate acetyl-CoA that is feeded into the TCA cycle. The TCA cycle generates NADH and FADH2, which serve as electron donors in the respiratory chain, ultimately resulting in the formation of ATP. All enzymes are represented by their gene names, and below each enzyme the number of identified lysine acetylation sites is given for rat and human muscle samples, respectively (rat/human).
Figure 4
Figure 4. Functional Analysis of Site-Specific Acetylation Sites on Glycolytic Enzymes
(A) Tissue distribution of lysine acetylation sites on enzymes involved in glycerol synthesis. For each enzymatic step, enzymes from human skeletal muscle (blue), rat brain (purple), and rat liver (green) are visualized with the number of lysine acetylation sites identified (yellow). For aldolase (ALDOA, ALDOB, and ALDOC) and phosphofructosekinase (PFKM, PFKC, and PFKL), tissue-specific isozymes were identified and are boxed in red color. (B) Tissue distribution of the mass spectrometric signal intensities of the ALDOB K147-acetylated peptide DGVDFGK(ac)WARAVLR. (C) Conservation of rat ALDOB K147 across species from human to probacteria and plants. (D) Catalytic activity of ALDOB WT and ALDOB K147Q toward fructose-1,6-bisphosphate assayed by downstream NADH oxidation, respectively (n = 3, mean ± SEM). The activity of ALDOB K174Q was below the assay detection limits of approximately 1 × 10⁻⁴ µmol/min/mg. (E) Enzymatic activity of GPD1 WT and GPD1 K120Q toward dihydroxyacetone phosphate measured by NADH oxidation, respectively (n = 3, mean ± SEM). The activity of GPD1 K120Q was below the assay detection limit of approximately 5 × 10⁻⁴ µmol/min/mg.
Figure 5
Figure 5. Cellular Compartment Distribution of Acetylated Proteins across Tissues
(A) All lysine-acetylated proteins were grouped based on their subcellular localization, and for each tissue the fraction of identified acetylated proteins per compartment was calculated. The deviation from the median was visualized as a heatmap according to the indicated color scale. For the clusters encircled by a red box, pathway enrichment analysis was performed, and the protein processes underlying significant overrepresentation is displayed. The number of acetylated proteins and sites per cellular compartment is provided in the table together with the average number of acetylation sites per protein per compartment and the fraction of acetylated proteins per compartment. (B) GO and pathway enrichment analyses were made for each subcellular compartment, and enriched Reactome pathways and GO terms for biological processes are listed with their corresponding p values color coded according to the scale. See also Figures S4 and S5.
Figure 6
Figure 6. Sequence Motifs for Lysine Acetylation Sites across Cellular Compartments
(A) Heatmap indicating overrepresentation of amino acids in positions from −6 to +6 from the acetylated lysine residue based on all identified acetylation sites compared to the overall proteome amino acid frequency distribution. (B) Sequence logos for acetylation sites identified on proteins residing in the nucleus, cytosol, mitochondria, or ER-Golgi. (C) Sequence logos for subsets of the nuclear proteins. Sites identified from histones and transcription factors were analyzed separately. (D) Table summarizing sequence motifs found for compartment-specific lysine acetylation sites with sequence motif and tissue enrichment p values indicated. See also Figure S6.

References

    1. Ahn BH, Kim HS, Song S, Lee IH, Liu J, Vassilopoulos A, Deng CX, Finkel T. A role for the mitochondrial deacetylase Sirt3 in regulating energy homeostasis. Proc. Natl. Acad. Sci. USA. 2008;105:14447–14452. - PMC - PubMed
    1. Ashburner M, Ball CA, Blake JA, Botstein D, Butler H, Cherry JM, Davis AP, Dolinski K, Dwight SS, Eppig JT, et al. The Gene Ontology Consortium. Gene ontology: tool for the unification of biology. Nat. Genet. 2000;25:25–29. - PMC - PubMed
    1. Bannister AJ, Miska EA, Görlich D, Kouzarides T. Acetylation of importin-alpha nuclear import factors by CBP/p300. Curr. Biol. 2000;10:467–470. - PubMed
    1. Bergholdt R, Størling ZM, Lage K, Karlberg EO, Olason PI, Aalund M, Nerup J, Brunak S, Workman CT, Pociot F. Integrative analysis for finding genes and networks involved in diabetes and other complex diseases. Genome Biol. 2007;8:R253. - PMC - PubMed
    1. Choudhary C, Kumar C, Gnad F, Nielsen ML, Rehman M, Walther TC, Olsen JV, Mann M. Lysine acetylation targets protein complexes and co-regulates major cellular functions. Science. 2009;325:834–840. - PubMed

Publication types

LinkOut - more resources