. 2012 Sep;30(9):858-67.
doi: 10.1038/nbt.2317.

Multiplexed mass cytometry profiling of cellular states perturbed by small-molecule regulators

Affiliations

Multiplexed mass cytometry profiling of cellular states perturbed by small-molecule regulators

Bernd Bodenmiller et al. Nat Biotechnol. 2012 Sep.

Abstract

Mass cytometry facilitates high-dimensional, quantitative analysis of the effects of bioactive molecules on human samples at single-cell resolution, but instruments process only one sample at a time. Here we describe mass-tag cellular barcoding (MCB), which increases mass cytometry throughput by using n metal ion tags to multiplex up to 2n samples. We used seven tags to multiplex an entire 96-well plate, and applied MCB to characterize human peripheral blood mononuclear cell (PBMC) signaling dynamics and cell-to-cell communication, signaling variability between PBMCs from eight human donors, and the effects of 27 inhibitors on this system. For each inhibitor, we measured 14 phosphorylation sites in 14 PBMC types at 96 conditions, resulting in 18,816 quantified phosphorylation levels from each multiplexed sample. This high-dimensional, systems-level inquiry allowed analysis across cell-type and signaling space, reclassified inhibitors and revealed off-target effects. High-content, high-throughput screening with MCB should be useful for drug discovery, preclinical testing and mechanistic investigation of human disease.


Figures

Figure 1
Figure 1. Mass-tag cell barcoding
a. Cells were covalently labeled with a bifunctional compound, maleimido-mono-amide-DOTA (mDOTA). This compound can be loaded with a lanthanide(III) isotope ion, and reacts covalently with cellular thiol groups via its maleimide moiety. b. Seven unique lanthanide isotopes were used to generate 128 combinations, enough to barcode each sample in a 96-well plate. The seven lanthanide isotopes, their masses, and their locations on the 96-well plate are shown. c. A density dot plot of barcoded cells is shown with the y-axis and x-axis plot showing barcoding channel 1 (lanthanum 139) vs. barcoding channel 2 (praseodymium 141). Cells positive and negative for a given channel are indicated. d. Cells (K562) were stimulated with orthovanadate, placed in a 96-well plate as geometrical patterns (checkerboard or striped pattern), barcoded, analyzed by mass cytometry and subsequently deconvoluted using Boolean gating to validate the accuracy of the (de)barcoding. The two resulting heat-maps of the measured SLP76 Tyr-696 phosphorylation levels are shown.
Figure 2
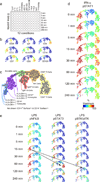
Figure 2. PBMC signaling time-course experiment
a. Twelve conditions and 8 different time points were used to capture time-resolved PBMC signal transduction from 0 to 240 min. b. The expression and localization of all quantified cell surface markers within the SPADE tree is shown. c. 14 unique PBMC cell types were distinguished by SPADE analysis based on surface marker expression shown in B. d. The time-resolved response of the PBMC continuum of subpopulations to IFN-α stimulation by STAT1 phosphorylation, as visualized by SPADE. e. Time-resolved response of the PBMC continuum of subpopulations to LPS stimulation by NFΚB, STAT3, and STAT1 phosphorylation, as visualized by SPADE. Putative intercellular communication is indicated by black arrows.
Figure 3
Figure 3. Signaling response comparison of PBMCs from eight donors
a. Twelve conditions were used to compare signaling response of PBMCs from eight different donors after 30 min stimulation. b. The expression of the CD3 cell surface marker within the SPADE tree for all donors is shown. c. The expression of the CD33 cell surface markers within the SPADE tree for all donors. d. Comparison of the response to 30 min BCR/FcR-XL stimulation of the PBMC continua of subpopulations of the analyzed donors as visualized by SPADE shown by the median phosphorylation levels of S6 protein. e. Correlation plot of the fold-change induction over all stimuli, phosphorylation site and cell type pairs between donors after 30 min stimulation. f. As d, but the median of phosphorylation on STAT5 after 30 min IFN-α stimulation is shown.
Figure 4
Figure 4. Analysis of PBMC response to kinase inhibition
a. The effect of 27 inhibitors on PBMC signaling was quantified by MCB, including the IC50 value and percent inhibition of phosphorylation levels b. Experimental set-up for each inhibitor experiment. Twelve stimulation conditions were applied for 30 min in conjunction with an eight-point, 4-fold dilution series of each inhibitor. c. Gating scheme. 10 cell surface markers were combined to define 14 cell types. d. For each cell type, 14 phosphorylation sites covering many immune signaling pathways were quantified by mass cytometry. Example dose response curves are shown for staurosporine treatment in CD4+ T cells.
Figure 5
Figure 5. Overview of inhibitor impact
a. A miniaturized signaling network, guided by canonical pathways, including vertical ordering of nodes from membrane-proximal signaling proteins to nuclear-localized transcription, is used here to depict the effect of a stimulus or inhibitor on each quantified phosphorylation site after 15 min incubation with the inhibitor and subsequent 30 min cell stimulation. As some antibodies recognize different proteins in different cell types, 3 cell type specific signaling networks are shown. In the absence of inhibitor (“No inhibitor”), the response to each stimulus relative to the untreated state is represented as fold change by a sized red or black circle (for induction and reduction of phosphorylation levels, respectively). For example, activation of B cells by IFN-α caused a ~1-fold induction of phosphorylated STAT1 and STAT3. To visualize the effects of inhibitors (“Inhibition”), circles were sized inversely to the IC50 and colored by amount of percent inhibition (“Inhibition”). For example, in the presence of ruxolitinib, inhibition of phosphorylation of STAT1 (IC50 = 23 nM, 93% inhibition) and STAT3 (IC50 = 4 nM, 147% inhibition) was observed (Fig. 5a, “Inhibitor”), while without activation of the B cells, no observable effects of ruxolitinib on the quantified signaling nodes were visible (Fig. 5b, yellow box). Fold-change induction before inhibition and confidence intervals for IC50 values and percent inhibition are not shown (Supplementary File 3). b. The impact of all inhibitors under all stimulation conditions is shown for IgM+ B cells. c. The impact of all inhibitors on all cell types after 30 min IFN-α stimulation is shown. Sections highlighted by color are detailed in the main text.
Figure 6
Figure 6. Principle component analysis of cell type and drug response
a. Cell type PCA analysis across all inhibitors, phosphorylation sites, and conditions. b. Cell type PCA analysis for streptonigrin across all phosphorylation sites and conditions. c. Inhibitor PCA analysis across all cell types, phosphorylation sites, and conditions. d. Inhibitor PCA analysis for monocytes after IFN-α stimulation across all phosphorylation sites. e. Pairwise distance correlation plot to show the agreement between in vivo data generated by MCB and in vitro kinome inhibition profiles as from Anastassiadis et al.. Distances shown were scaled as a fraction of the maximum distance. f. As e, but pairwise distance correlation plot between in vivo data generated by MCB and in vitro kinome inhibition profiles as from Davis et al. is shown.

References

    1. Paul SM, et al. How to improve R&D productivity: the pharmaceutical industry's grand challenge. Nat Rev Drug Discov. 2010;9:203–214. - PubMed
    1. Nolan GP. What's wrong with drug screening today. Nat Chem Biol. 2007;3:187–191. - PubMed
    1. Kola I, Landis J. Can the pharmaceutical industry reduce attrition rates? Nat Rev Drug Discov. 2004;3:711–715. - PubMed
    1. Kramer JA, Sagartz JE, Morris DL. The application of discovery toxicology and pathology towards the design of safer pharmaceutical lead candidates. Nat Rev Drug Discov. 2007;6:636–649. - PubMed
    1. Kolch W, Pitt A. Functional proteomics to dissect tyrosine kinase signalling pathways in cancer. Nat Rev Cancer. 2010;10:618–629. - PubMed

Publication types

MeSH terms

Substances