. 2012 Oct 12;48(1):52-62.
doi: 10.1016/j.molcel.2012.07.013. Epub 2012 Aug 16.

Regulation of yeast pyruvate kinase by ultrasensitive allostery independent of phosphorylation

Affiliations

Regulation of yeast pyruvate kinase by ultrasensitive allostery independent of phosphorylation

Yi-Fan Xu et al. Mol Cell. .

Abstract

Allostery and covalent modification are major means of fast-acting metabolic regulation. Their relative roles in responding to environmental changes remain, however, unclear. Here we examine this issue, using as a case study the rapid decrease in pyruvate kinase flux in yeast upon glucose removal. The main pyruvate kinase isozyme (Cdc19) is phosphorylated in response to environmental cues. It also exhibits positively cooperative (ultrasensitive) allosteric activation by fructose-1,6-bisphosphate (FBP). Glucose removal causes accumulation of Cdc19's substrate, phosphoenolpyruvate. This response is retained in strains with altered protein-kinase-A or AMP-activated-protein-kinase activity or with CDC19 carrying mutated phosphorylation sites. In contrast, yeast engineered with a CDC19 point mutation that ablates FBP-based regulation fail to accumulate phosphoenolpyruvate. They also fail to grow on ethanol and slowly resume growth upon glucose upshift. Thus, while yeast pyruvate kinase is covalently modified in response to glucose availability, its activity is controlled almost exclusively by ultrasensitive allostery.


Figures

Figure 1
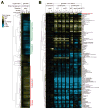
Figure 1. Glucose removal results in PEP accumulation
(A). S. cerevisiae cells (strain Y3358) growing in minimal media containing 2% glucose were switched to minimal media containing no carbon, 2% glycerol + 2% ethanol, or 2% ethanol. After the indicated duration of glucose removal, the metabolome was quantified by LC-MS. Experiments were performed using either liquid culture (more complete glucose removal) or filter culture (faster sampling). (B). S. cerevisiae cells (strain Y3358) growing in minimal media were switched to minimal media containing no nitrogen or no phosphate and metabolome quantitated by LC-MS. Experiments were performed using liquid culture. In (A) and (B), data are shown in heat map format, with each line reflecting the dynamics of a particular compound in a particular culture condition. Metabolite levels of biological duplicates were averaged, normalized to cells growing steadily in glucose (time zero), and the resulting fold changes log transformed. G6P, glucose-6-phosphate; F6P. fructose-6-phosphate; FBP, fructose-1,6-bisphosphate; GAP, glyceraldehyde-3-phosphate; DHAP, dihydroxyacetone phosphate; DPG, 1,3-diphosphateglycerate; 3PG, 3-phosphoglycerate; 2PG, 2-phosphoglycerate; G6P and F6P, GAP and DHAP, and 3PG and 2PG were not differentiated by the LC-MS method employed.
Figure 2
Figure 2. Accumulated PEP does not derive from TCA cycle intermediates
(A). Experimental design. Yeast filter cultures (strain Y3358) were grown on 2% unlabeled glucose, and suddenly transferred to 2% U-13C-ethanol as the sole carbon source. A various time points thereafter, metabolites were quantitated by LC-MS. (B). Exogenous 13C-ethanol is incorporated into TCA intermediates but not PEP. The x axis represents minutes after the switch, and the y axis represents absolute intracellular concentration (mean ± range of N = 2 biological replicates).
Figure 3
Figure 3. Transcriptome and metabolome response to inhibition of glucose-sensing kinases
(A) Transcriptome. (B) Metabolome. Note that PEP levels are robust to manipulation of glucose-signaling kinases but sensitive to a point mutation of Cdc19 that ablates allosteric activation by FBP (cdc19E392A). In the columns marked “glucose”, transcripts and metabolites of yeast cells growing in minimal liquid media containing 2% glucose were measured during exponential phase starting at A600 of 0.4. When indicated, 1 μM analogue 1NM-PP1 was added at time 0 to deactivate genetically engineered PKA (pkaas). In the columns marked “glucose no→carbon,” cells were switched to no carbon and metabolome quantitated by LC-MS. When indicated, 1 μM analogue mMe-PP1 was added at time 0 to deactivate genetically engineered SNF1 (snf1as). Higher analogue concentrations (2.5 uM and 25 uM) were also tested, with identical results observed. All experiments in this figure were performed using liquid culture, and all reported values are log2 transformed fold changes relative to time 0; all metabolites data are mean of duplicate samples at each time point . Strains: Y2864, auxotrophic WT; Y3561, pkaas ; Y3504, snf1as; Y3358, prototrophic WT; Y3898, cdc19E392A.
Figure 4
Figure 4. PEP accumulation upon glucose removal does not require Cdc19 covalent modification
(A). Cdc19 phosphorylation before and after glucose removal. The relative extent of phosphorylation is defined as: (ion count for the phosphopeptide)/(ion count for the phosphopeptide + ion count for its unphosphorylated form) with ion counts for phosphopeptides measured in phosphoenriched samples and those for unphosphorylated peptides in unenriched samples. Due to differences in enrichment and ionization efficiency, this ratio provides only qualitative information regarding the stoichiometry of the phosphorylation events. Differences before and after glucose removal reflect isotope ratio-based measurements and are therefore quantitative. (B). Mutation of Cdc19’s phosphorylation sites to alanine or glutamate does not prevent PEP accumulation. The x axis represents minutes after glucose removal, and the logarithmic y axis represents absolute intracellular PEP concentration (mean ± range of N = 2 biological replicates).
Figure 5
Figure 5. Pyruvate kinase exhibits cooperative activation by FBP independent of its phosphorylation status
(A). Activity of purified His-tagged Cdc19 as a function of FBP concentration. The three small plots differ in terms of PEP concentration added, increasing from 0.03 mM (left-most) to 20 mM (right-most). (B). Activity of Cdc19 variants in which the indicated phosphorylation site has been changed to alanine or glutamate in the presence of 0.8 mM PEP. The x axis represents FBP concentration, and the y axis represents specific pyruvate kinase activity in enzyme activity Units (μmol of product produced per minute) per mg of enzyme. Experimental data (mean ± range of N = 2) were fit to Hill-equations (lines). Numbers in the plots are the Hill-coefficient (nH), and the FBP concentration producing half-maximal activation (Khalf).
Figure 6
Figure 6. Allosteric regulation of Cdc19 by FBP is essential for glucose removal-induced PEP accumulation
(A). The Cdc19 E392A variant is active in the absence of FBP. Pyruvate kinase activity was measured in the presence of 0.8 mM PEP and varying concentrations of FBP as per Figure 5. (B). Genomic substitution of wild type pyruvate kinase with E392A (cdc19E392A) eliminates PEP accumulation upon glucose removal. The x axis represents minutes after the indicated switch, and the y axis represents absolute intracellular PEP concentration (mean ± range of N = 2 biological replicates). Experiments were performed using filter culture.
Figure 7
Figure 7. Cdc19 allosteric regulation facilitates energy charge homeostasis upon glucose up-shift and enhances growth on oscillating glucose
(A). Experimental design for (B) and (C). Filter cultures growing on glucose were switched to no carbon media for 30 min. Thereafter, cells were switched to glucose and metabolome quantified. (B). [PEP], energy charge = ([ATP] + 0.5 [ADP]) / ([ATP] + [ADP] + [AMP]), and [IMP] upon glucose re-addition in wild type and cdc19E392A yeast. The logarithmic x axis represents seconds after glucose re-addition, and the y axis represents absolute intracellular metabolite concentration (mean ± range of N = 2 biological replicates). (C). Same as (B) but for amd1 and cdc19E392Aamd1 strains. Amd1 catalyzes conversion of AMP to IMP. (D). Experimental design for (E) and (F). Filter cultures were alternated between glucose and no carbon media every 30 min for ~ 10 h and growth monitored. (E). Growth of wild type and cdc19E392A yeast on steady versus oscillating glucose. Closed symbols = steady glucose, open symbols = oscillating glucose, blue = wild type, red = cdc19E392A. The x axis represents time in hours, and the logarithmic y axis represents optical density (A600) (mean ± range of N = 2 biological replicates). (F). Same as (E) but for amd1 (Y3996) and cdc19E392Aamd1 (Y3997).

References

    1. Arguelles JC, Carrillo D, Vicentesoler J, Garciacarmona F, Gacto M. Lack of Correlation between Trehalase Activation and Trehalose-6 Phosphate Synthase Deactivation in Camp-Altered Mutants of Saccharomyces-Cerevisiae. Current Genetics. 1993;23:382–387. - PubMed
    1. Bennett BD, Yuan J, Kimball EH, Rabinowitz JD. Absolute quantitation of intracellular metabolite concentrations by an isotope ratio-based approach. Nature Protocols. 2008;3:1299–1311. - PMC - PubMed
    1. Blair JB, Walker RG. Rat liver pyruvate kinase: influence of ligands on activity and fructose 1,6-bisphosphate binding. Arch Biochem Biophys. 1984;232:202–213. - PubMed
    1. Blank LM, Kuepfer L, Sauer U. Large-scale 13C-flux analysis reveals mechanistic principles of metabolic network robustness to null mutations in yeast. Genome Biol. 2005;6:R49. - PMC - PubMed
    1. Bodenmiller B, Wanka S, Kraft C, Urban J, Campbell D, Pedrioli PG, Gerrits B, Picotti P, Lam H, Vitek O, et al. Phosphoproteomic Analysis Reveals Interconnected System-Wide Responses to Perturbations of Kinases and Phosphatases in Yeast. Sci Signal. 2010:3. - PMC - PubMed

Publication types