. 2012 Dec 1;61(4):407-16.
doi: 10.1097/QAI.0b013e318269c414.

Disease Progression in HIV-1-Infected Viremic Controllers

Affiliations

Disease Progression in HIV-1-Infected Viremic Controllers

Katherine C Groves et al. J Acquir Immune Defic Syndr. .

Abstract

Background: The mechanism of CD4 T-cell decline in HIV-1 infection is unclear, but the association with plasma viral RNA load suggests viral replication is involved. Indeed, viremic controller patients with low viral RNA loads typically maintain high CD4 T-cell counts. Within a local cohort of 86 viremic controllers, we identify a subgroup (18 "discord controllers") with low CD4 T-cell counts that present clinical uncertainty. The underlying mechanism accounting for CD4 T-cell decline in the face of low or undetectable plasma (RNA) viral load remains unresolved. The objective of this study was to investigate the viral and host immune system dynamics in discord controllers by measuring cellular HIV-1 DNA load, T-cell populations, and T-cell activation markers.

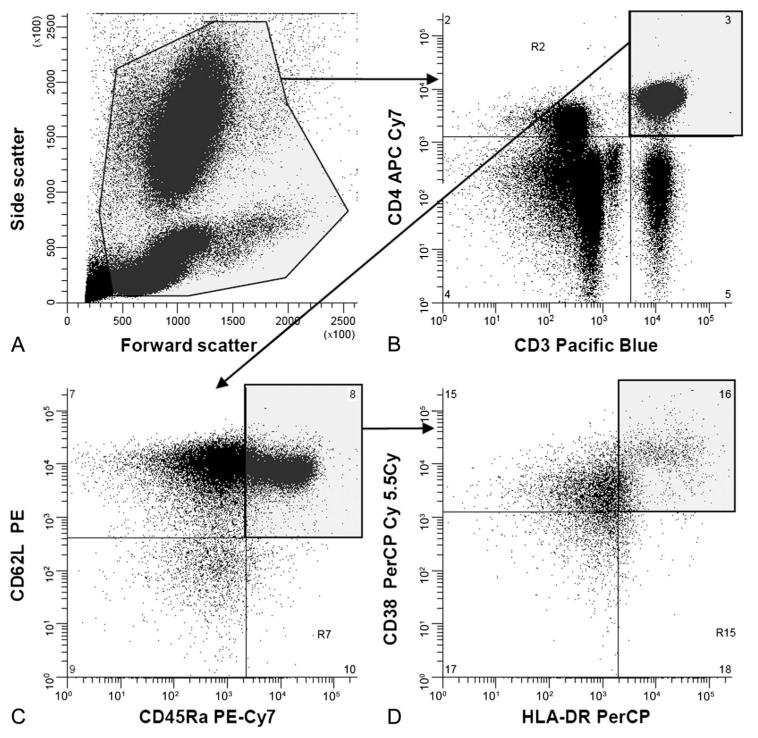
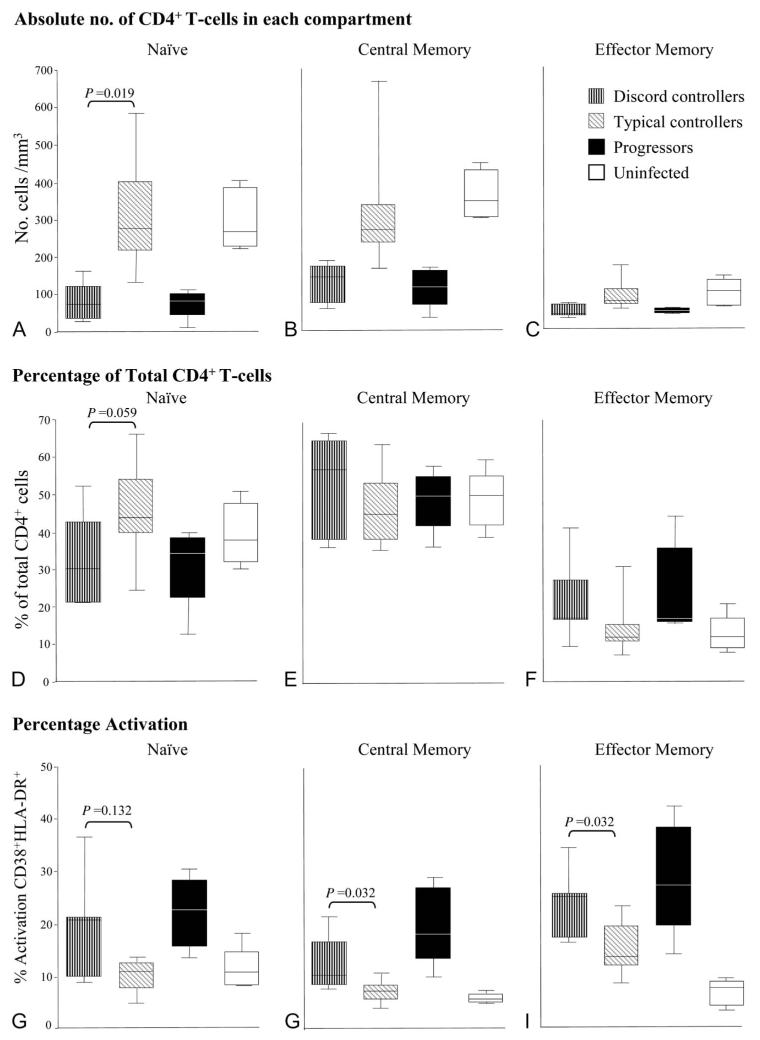
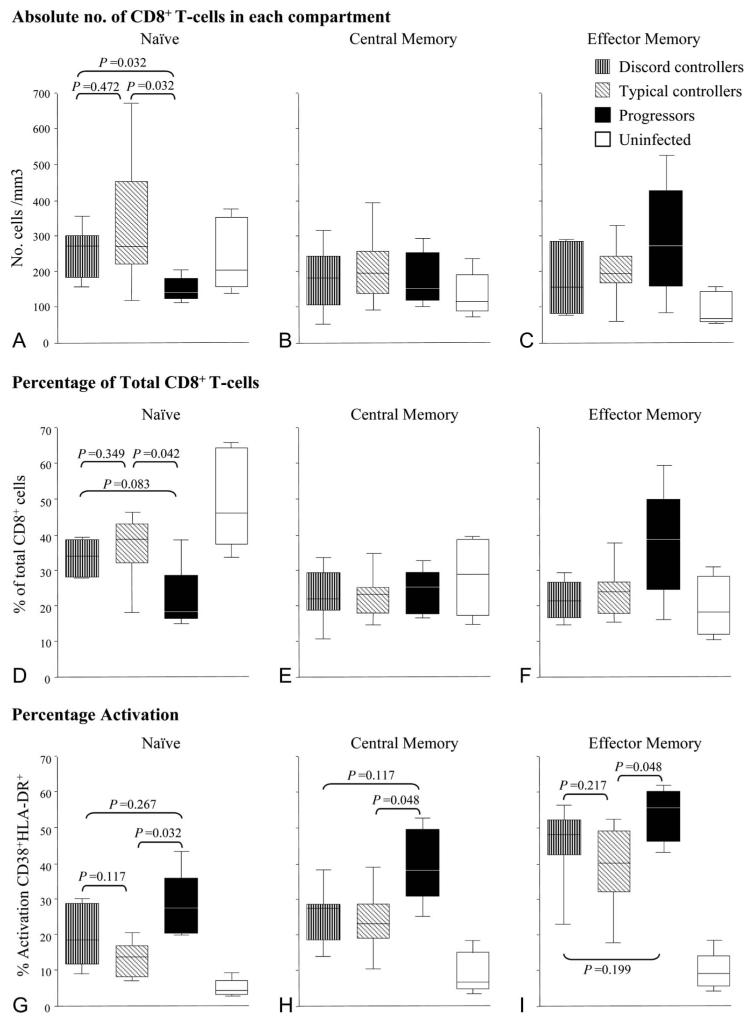
Methods: We compared discord controllers (viral RNA load <2000 copies/mL, <450 CD4 T-cells/mm) with typical controllers (viral RNA load <2000 copies/mL, >450 CD4 T-cells/mm) and progressors (viral RNA load >10,000 copies/mL, <450 CD4 T-cells/mm). We quantified CD4/CD8 naive/central memory/effector memory subsets (CD45RA/RO ± CD62L), activation levels (CD38HLA-DR), and HIV-1 DNA load.

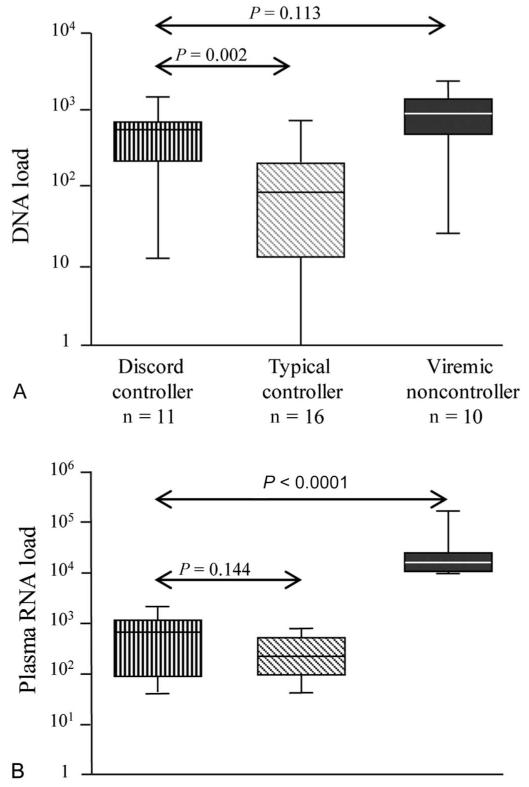
Results: Discord controllers resembled progressors showing high viral DNA load, depletion of naive CD4 T-cells, and higher activation in all CD4 T-cell subsets, compared with typical controllers. They were similar to typical controllers with lower CD8 T-cell activation compared with progressors.

Conclusions: Our data are consistent with a relationship between CD4 T-cell activation and disease progression. HIV-1 DNA load may be a better marker of viral replication and disease progression than viral RNA load. Lower level CD8 T-cell activation correlates with low viral RNA load but not with disease progression or viral DNA load.


Figures

FIGURE 1
FIGURE 1
Gating strategy for flow cytometric analysis of T-cell subsets. A, Forward and side scatter to define viable cell gate. B, Double staining of viable cells with anti-CD3 and anti-CD4. CD4+ T-cells are in the top right quadrant; CD4 T-cells (predominately CD8+ T-cells) are in the bottom right quadrant. C, Double staining of CD4+ T-cells with anti-CD45RA and anti-CD62L, naive CD62L+CD45RA+ T-cells, defined with reference to staining with isotype-matched control antibodies, are in the top right quadrant. D, Double staining of naive CD4+ T-cells with anti-CD38 and anti-HLA-DR, activated CD38+HLA-DR+ T-cells, defined with reference to staining with isotype-matched control antibodies, are in the upper right quadrant.
FIGURE 2
FIGURE 2
Representation of CD4+ T-cell subsets by patient group. Patients analyzed included 7 patients with discord controller phenotype [median (IQR) for viral RNA load 675 (128–1320) copies/mL, CD4+ T-cells/mm3 337 (267–400)]; 12 patients showing the typical controller phenotype [viral RNA load 268 (116–926) copies/mL, CD4+ T-cells/mm3 815 (691–971)], 5 progressors [viral RNA load 60,683 (28,603–155,518) copies/mL, CD4+ T-cells/mm3 309 (296–339)], and 5 uninfected subjects. Progressors: age 35 (30–48) years, female 40%, CD4+ T-cell count 309 (287–346) cells/mm3, HIV-1 RNA load 60,682 (23,947–232,854) copies per milliliter, all reported as median (range). Absolute numbers of cells in CD4+ T-cell subsets are shown in (A) naive (CD45RA+CD62L+), (B) central memory (CD45RO+CD62L+), and (C) effector memory (CD45RO+CD62L). Percentage of cells in CD4+ T-cell subsets compared with total CD4+ T-cell pool are shown for (D) naive, (E) central memory, and (F) effector memory. Percentage activation of cells in CD4+ T-cell subsets (as percentage of total cells in that subset) by patient group is shown in (G–I). Each central bar represents the median value, each box represents the IQR, and the whiskers represent the minimum and maximum values. Statistical analysis employed a Mann–Whitney U test.
FIGURE 3
FIGURE 3
Representation of CD8+ T-cell subsets by patient group. Patients analyzed as described in Figure 2: discord controllers, typical controllers, progressors, and uninfected subjects. Absolute numbers of cells in CD8+ T-cell subsets are shown in (A) naive (CD45RA+CD62L+), (B) central memory (CD45RO+CD62L+), and (C) effector memory (CD45RO+CD62L). Percentage of cells in CD8+ T-cell subsets compared with total CD8+ T-cell pool are shown for (D) naive, (E) central memory, and (F) effector memory. Percentage activation of cells in CD8+ T-cell subsets (as percentage of total cells in that subset) by patient group is shown in (G–I). Each central bar represents the median value, each box represents the IQR, and the whiskers represent the minimum and maximum values. Statistical analysis employed a Mann–Whitney U test.
FIGURE 4
FIGURE 4
HIV-1 DNA load compared with HIV-1 RNA load in patient groups. A, viral DNA load (DNA copies per 106 CD4+ T-cells; log10 scale) as compared with B, Plasma viral RNA load (copies/mL; log10 scale) by patient group. Each central bar represents the median value, each box represents the IQR, and the whiskers represent the minimum and maximum values. Viremic noncontrollers: age 42 (28–66) years, female 10%, CD4+ T-cell count 399 (258–716) cells/mm3, HIV-1 RNA load 15,809 (10,041–169,049) copies per milliliter, all reported as median (range). Median (range) of CD4+ T-cell count values (cells/mm3) within 12 months before the sample tested for plasma HIV-1 DNA load were 339 (251–424) for discord controllers; 775 (499–1326) for typical controllers; 399 (258–716) for viremic noncontrollers. Statistical analysis employed a Mann–Whitney U test.

References

    1. Haase AT. Population biology of HIV-1 infection: viral and CD4+ T cell demographics and dynamics in lymphatic tissues. Annu Rev Immunol. 1999;17:625–656. - PubMed
    1. Hellerstein M, Hanley MB, Cesar D, et al. Directly measured kinetics of circulating T lymphocytes in normal and HIV-1-infected humans. Nat Med. 1999;5:83–89. - PubMed
    1. Rodriguez B, Sethi AK, Cheruvu VK, et al. Predictive value of plasma HIV RNA level on rate of CD4 T-cell decline in untreated HIV infection. JAMA. 2006;296:1498–1506. - PubMed
    1. Deeks SG, Kitchen CMR, Liu L, et al. Immune activation set point during early HIV infection predicts subsequent CD4+ T-cell changes independent of viral load. Blood. 2004;104:942–947. - PubMed
    1. Giorgi JV, Hultin LE, McKeating JA, et al. Shorter survival in advanced human immunodeficiency virus type 1 infection is more closely associated with T lymphocyte activation than with plasma virus burden or virus chemokine coreceptor usage. J Infect Dis. 1999;179:859–870. - PubMed

Publication types